Downtime categories#
import matplotlib.pyplot as plt
import pandas as pd
# configure plot styles
plt.style.use("seaborn-colorblind")
plt.rcParams["font.family"] = "Source Sans Pro"
plt.rcParams["figure.dpi"] = 96
plt.rcParams["axes.grid"] = False
plt.rcParams["figure.titleweight"] = "semibold"
plt.rcParams["axes.titleweight"] = "semibold"
plt.rcParams["figure.titlesize"] = "13"
plt.rcParams["axes.titlesize"] = "12"
plt.rcParams["axes.labelsize"] = "10"
data_cat = pd.read_csv("data/processed/downtime_categories.csv")
data_ts = pd.read_csv(
    "data/processed/downtime_timeseries.csv",
    lineterminator="\n",
    parse_dates=["timestamp_start", "timestamp_end"],
)
data_ts["period"] = data_ts["timestamp_end"] - data_ts["timestamp_start"]
data_ts["period"] = data_ts["period"].dt.total_seconds() / (60 * 60)
data = pd.DataFrame(data_ts.groupby(["TurbineCategory_id"]).count()["id"])
data.rename(columns={"id": "frequency"}, inplace=True)
data["Category"] = data.index
data["period"] = data_ts.groupby(["TurbineCategory_id"]).sum()["period"]
data["frequency/t/y"] = data["frequency"] / (25 * 2.5)
data["period/t/y"] = data["period"] / (25 * 2.5)
data_cat = data_cat[data_cat["Type"] == "Turbine"]
data_cat = data_cat.drop(columns=["Type"])
data = pd.concat([data, data_cat], axis=1)
data.fillna(0, inplace=True)
data.sort_values(by="frequency", inplace=True)
data
| frequency | Category | period | frequency/t/y | period/t/y | Category | Name | |
|---|---|---|---|---|---|---|---|
| 17 | 0.0 | 0.0 | 0.000000 | 0.000 | 0.000000 | 17 | Retrofit |
| 0 | 0.0 | 0.0 | 0.000000 | 0.000 | 0.000000 | 0 | Unknown |
| 14 | 0.0 | 0.0 | 0.000000 | 0.000 | 0.000000 | 14 | Noise Constraints |
| 21 | 1.0 | 21.0 | 3.560278 | 0.016 | 0.056964 | 21 | Delayed Startup |
| 4 | 9.0 | 4.0 | 5.441111 | 0.144 | 0.087058 | 4 | Main Shaft |
| 12 | 11.0 | 12.0 | 0.245278 | 0.176 | 0.003924 | 12 | Unlogged manual stop |
| 19 | 58.0 | 19.0 | 542.960833 | 0.928 | 8.687373 | 19 | Hub |
| 16 | 214.0 | 16.0 | 408.461667 | 3.424 | 6.535387 | 16 | Tower |
| 9 | 227.0 | 9.0 | 493.191667 | 3.632 | 7.891067 | 9 | Hydraulics |
| 3 | 256.0 | 3.0 | 596.369167 | 4.096 | 9.541907 | 3 | Rotor Brake |
| 22 | 329.0 | 22.0 | 810.376389 | 5.264 | 12.966022 | 22 | Other |
| 2 | 359.0 | 2.0 | 1030.276667 | 5.744 | 16.484427 | 2 | Anemometry |
| 18 | 478.0 | 18.0 | 178.107778 | 7.648 | 2.849724 | 18 | Cable Unwind |
| 13 | 553.0 | 13.0 | 9833.588056 | 8.848 | 157.337409 | 13 | Customer Stop |
| 7 | 614.0 | 7.0 | 980.310833 | 9.824 | 15.684973 | 7 | Yaw System |
| 20 | 686.0 | 20.0 | 5978.126389 | 10.976 | 95.650022 | 20 | Rotor Blades |
| 6 | 866.0 | 6.0 | 5249.156667 | 13.856 | 83.986507 | 6 | Generator |
| 5 | 1122.0 | 5.0 | 12545.892222 | 17.952 | 200.734276 | 5 | Gearbox |
| 15 | 1968.0 | 15.0 | 1561.361944 | 31.488 | 24.981791 | 15 | Scheduled Maintenance |
| 8 | 2042.0 | 8.0 | 8063.895000 | 32.672 | 129.022320 | 8 | Electrical Controls |
| 10 | 3182.0 | 10.0 | 8457.707500 | 50.912 | 135.323320 | 10 | Electrical System |
| 1 | 3560.0 | 1.0 | 8635.941111 | 56.960 | 138.175058 | 1 | OK |
| 11 | 5790.0 | 11.0 | 20375.991944 | 92.640 | 326.015871 | 11 | Pitch Control |
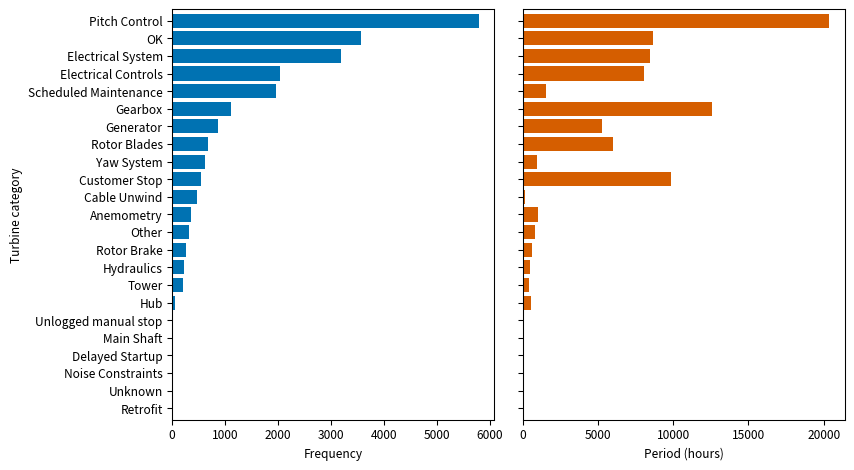
fig, ax = plt.subplots(ncols=2, sharey=True, figsize=(9, 5))
data.plot.barh("Name", "frequency", ax=ax[0], color="C0", width=0.8)
data.plot.barh("Name", "period", ax=ax[1], color="C2", width=0.8)
ax[0].set_ylabel("Turbine category")
ax[0].set_xlabel("Frequency")
ax[1].set_xlabel("Period (hours)")
ax[0].get_legend().remove()
ax[1].get_legend().remove()
fig.tight_layout()
plt.minorticks_off()
plt.show()
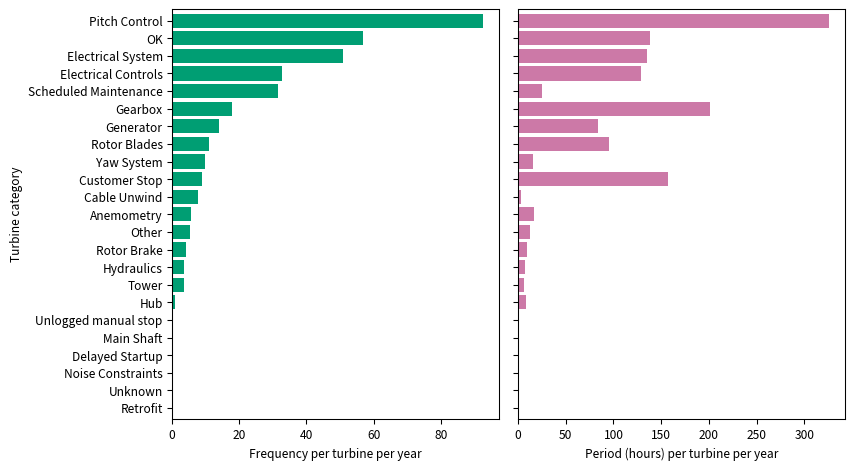
fig, ax = plt.subplots(ncols=2, sharey=True, figsize=(9, 5))
data.plot.barh("Name", "frequency/t/y", ax=ax[0], color="C1", width=0.8)
data.plot.barh("Name", "period/t/y", ax=ax[1], color="C3", width=0.8)
ax[0].set_ylabel("Turbine category")
ax[0].set_xlabel("Frequency per turbine per year")
ax[1].set_xlabel("Period (hours) per turbine per year")
ax[0].get_legend().remove()
ax[1].get_legend().remove()
fig.tight_layout()
plt.minorticks_off()
plt.show()