Finding the normal pitch angle threshold#
import itertools

import matplotlib.pyplot as plt
import pandas as pd
# import data
df = pd.read_csv("data/SCADA_merged.csv", skip_blank_lines=True)
# list of turbines to plot
# plot these three turbines to visualise the difference
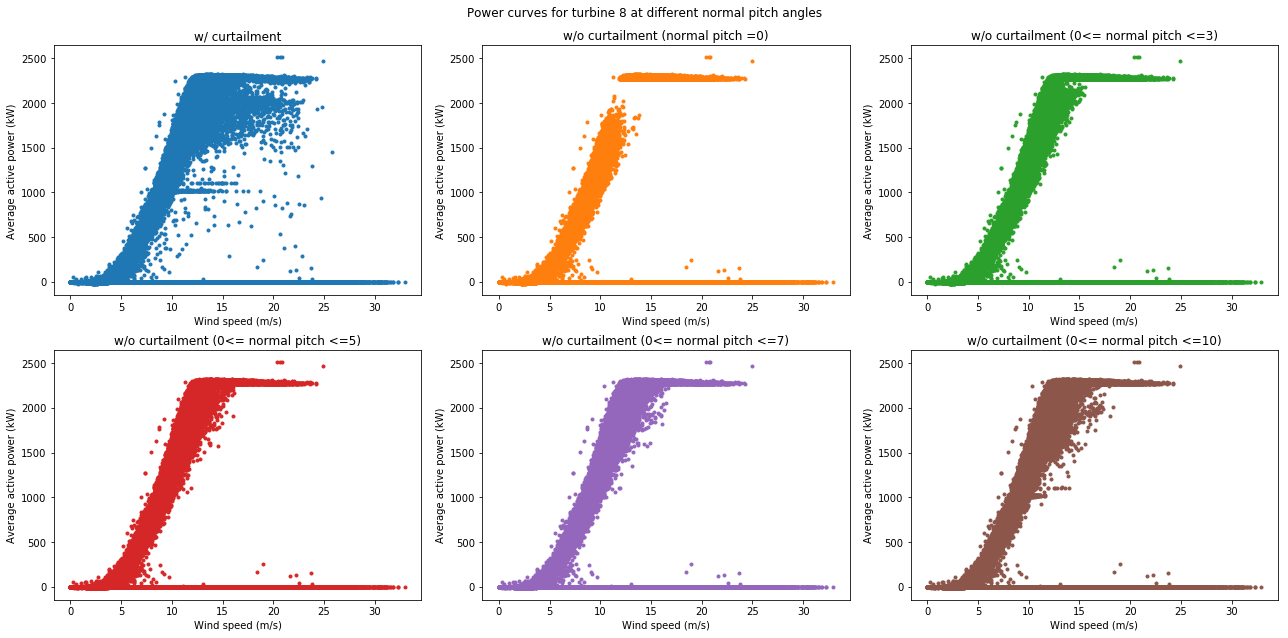
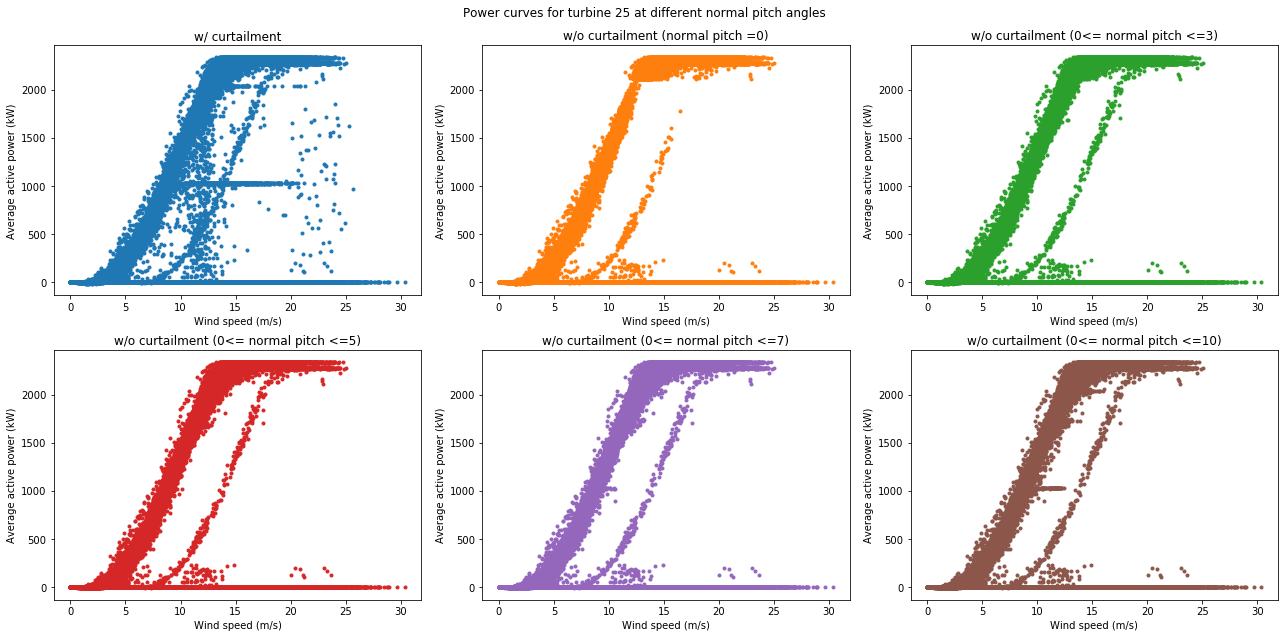
list1 = [1, 8, 25]
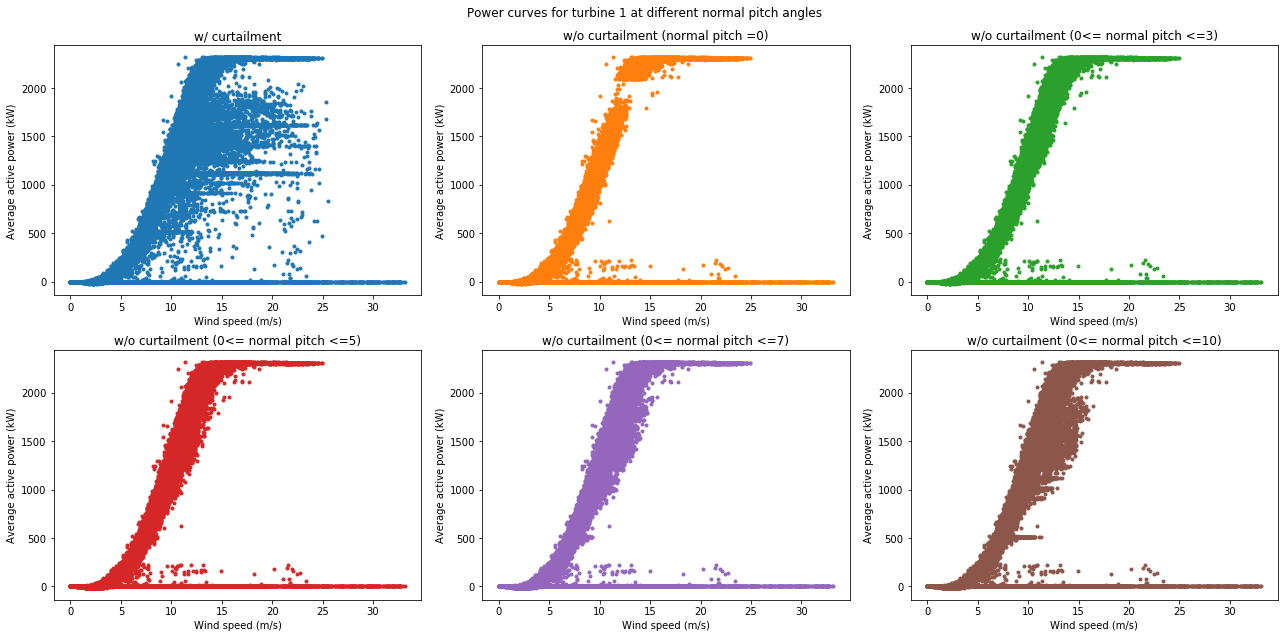
# plot for pitch angle = 0, 3, 5, 7 and 10 deg
for x in list1:
    # filter only data for turbine x
    dfx = df[(df["turbine"] == x)].copy()

    # filter out curtailment - curtailed when turbine is pitching
    # above (and/or below) a certain threshold
    # 0 deg - normal pitch
    def f0(c):
        if c["pitch"] == 0 or (
            c["pitch"] != 0
            and (
                c["ap_av"] <= (0.1 * dfx["ap_av"].max())
                or c["ap_av"] >= (0.9 * dfx["ap_av"].max())
            )
        ):
            return "normal"
        else:
            return "curtailed"

    dfx["curtailment0"] = dfx.apply(f0, axis=1)

    # 3 deg
    def f1(c):
        if 0 <= c["pitch"] <= 3 or (
            (c["pitch"] > 3 or c["pitch"] < 0)
            and (
                c["ap_av"] <= (0.1 * dfx["ap_av"].max())
                or c["ap_av"] >= (0.9 * dfx["ap_av"].max())
            )
        ):
            return "normal"
        else:
            return "curtailed"

    dfx["curtailment1"] = dfx.apply(f1, axis=1)

    # 5 deg
    def f2(c):
        if 0 <= c["pitch"] <= 5 or (
            (c["pitch"] > 5 or c["pitch"] < 0)
            and (
                c["ap_av"] <= (0.1 * dfx["ap_av"].max())
                or c["ap_av"] >= (0.9 * dfx["ap_av"].max())
            )
        ):
            return "normal"
        else:
            return "curtailed"

    dfx["curtailment2"] = dfx.apply(f2, axis=1)

    # 7 deg
    def f3(c):
        if 0 <= c["pitch"] <= 7 or (
            (c["pitch"] > 7 or c["pitch"] < 0)
            and (
                c["ap_av"] <= (0.1 * dfx["ap_av"].max())
                or c["ap_av"] >= (0.9 * dfx["ap_av"].max())
            )
        ):
            return "normal"
        else:
            return "curtailed"

    dfx["curtailment3"] = dfx.apply(f3, axis=1)

    # 10 deg
    def f4(c):
        if 0 <= c["pitch"] <= 10 or (
            (c["pitch"] > 10 or c["pitch"] < 0)
            and (
                c["ap_av"] <= (0.1 * dfx["ap_av"].max())
                or c["ap_av"] >= (0.9 * dfx["ap_av"].max())
            )
        ):
            return "normal"
        else:
            return "curtailed"

    dfx["curtailment4"] = dfx.apply(f4, axis=1)

    # filter data for plots
    # normal w/o curtailment 0 deg
    df1 = dfx[dfx.curtailment0 == "normal"]
    # normal w/o curtailment 3 deg
    df2 = dfx[dfx.curtailment1 == "normal"]
    # normal w/o curtailment 5 deg
    df3 = dfx[dfx.curtailment2 == "normal"]
    # normal w/o curtailment 7 deg
    df4 = dfx[dfx.curtailment3 == "normal"]
    # normal w/o curtailment 10 deg
    df5 = dfx[dfx.curtailment4 == "normal"]

    # get x and y coordinates
    # normal w/ curtailment
    x1 = dfx["ws_av"]
    y1 = dfx["ap_av"]
    # normal w/o curtailment 0 deg pitch
    x2 = df1["ws_av"]
    y2 = df1["ap_av"]
    # normal w/o curtailment 3 deg
    x3 = df2["ws_av"]
    y3 = df2["ap_av"]
    # normal w/o curtailment 5 deg
    x4 = df3["ws_av"]
    y4 = df3["ap_av"]
    # normal w/o curtailment 7 deg
    x5 = df4["ws_av"]
    y5 = df4["ap_av"]
    # normal w/o curtailment 10 deg
    x6 = df5["ws_av"]
    y6 = df5["ap_av"]

    # plot the figure
    fig = plt.figure(figsize=(18, 9), dpi=1500)

    ax1 = fig.add_subplot(231)
    ax1.scatter(x1, y1, marker=".", c="C0")
    plt.xlabel("Wind speed (m/s)")
    plt.ylabel("Average active power (kW)")
    plt.title("w/ curtailment")

    ax2 = fig.add_subplot(232)
    ax2.scatter(x2, y2, marker=".", c="C1")
    plt.xlabel("Wind speed (m/s)")
    plt.ylabel("Average active power (kW)")
    plt.title("w/o curtailment (normal pitch =0)")

    ax3 = fig.add_subplot(233)
    ax3.scatter(x3, y3, marker=".", c="C2")
    plt.xlabel("Wind speed (m/s)")
    plt.ylabel("Average active power (kW)")
    plt.title("w/o curtailment (0<= normal pitch <=3)")

    ax4 = fig.add_subplot(234)
    ax4.scatter(x4, y4, marker=".", c="C3")
    plt.xlabel("Wind speed (m/s)")
    plt.ylabel("Average active power (kW)")
    plt.title("w/o curtailment (0<= normal pitch <=5)")

    ax5 = fig.add_subplot(235)
    ax5.scatter(x5, y5, marker=".", c="C4")
    plt.xlabel("Wind speed (m/s)")
    plt.ylabel("Average active power (kW)")
    plt.title("w/o curtailment (0<= normal pitch <=7)")

    ax6 = fig.add_subplot(236)
    ax6.scatter(x6, y6, marker=".", c="C5")
    plt.xlabel("Wind speed (m/s)")
    plt.ylabel("Average active power (kW)")
    plt.title("w/o curtailment (0<= normal pitch <=10)")

    fig.suptitle(
        "Power curves for turbine %s" % x + " at different normal pitch angles"
    )
    plt.tight_layout()
    plt.subplots_adjust(top=0.92)
    plt.show()
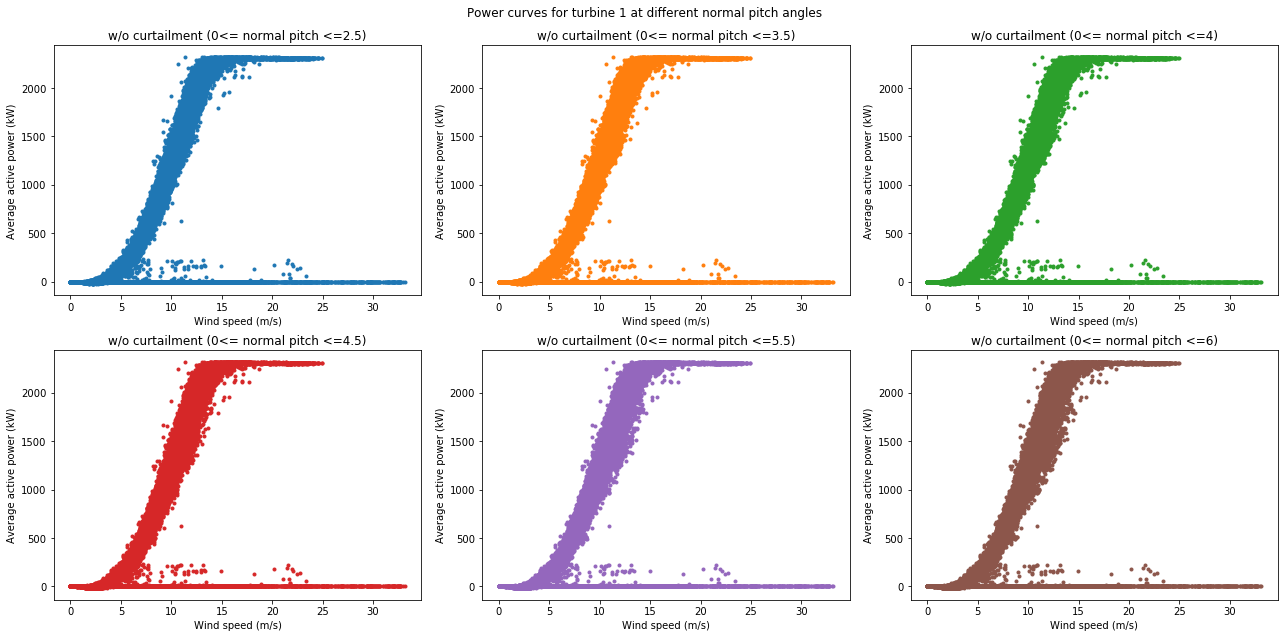
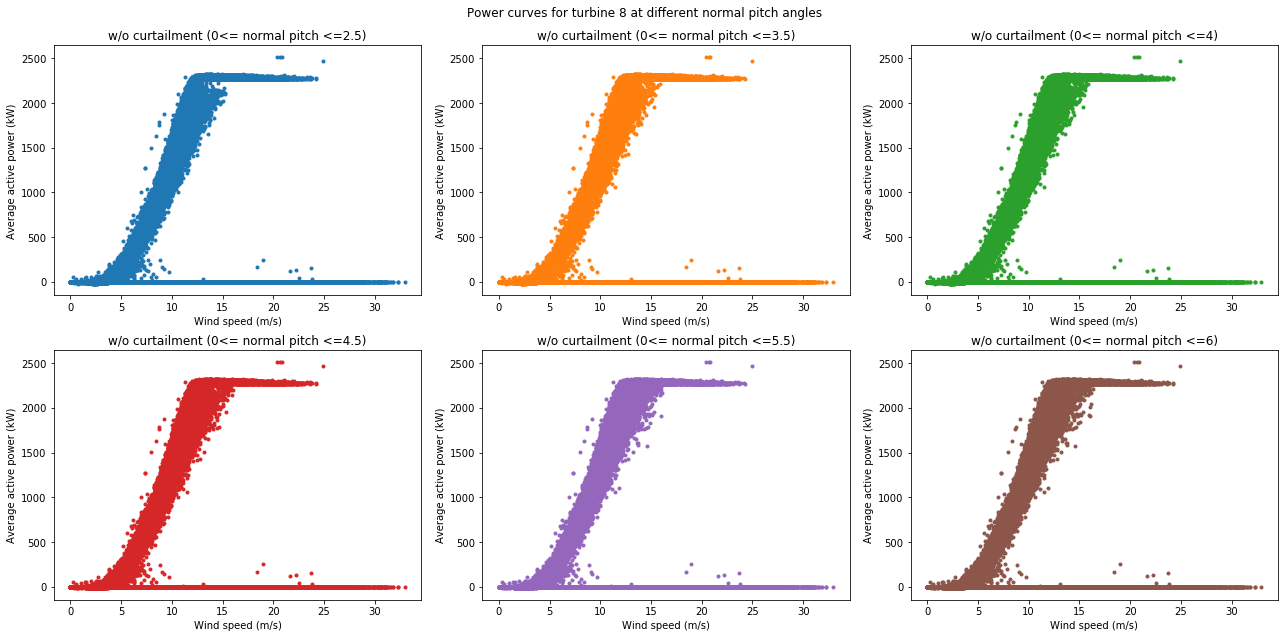
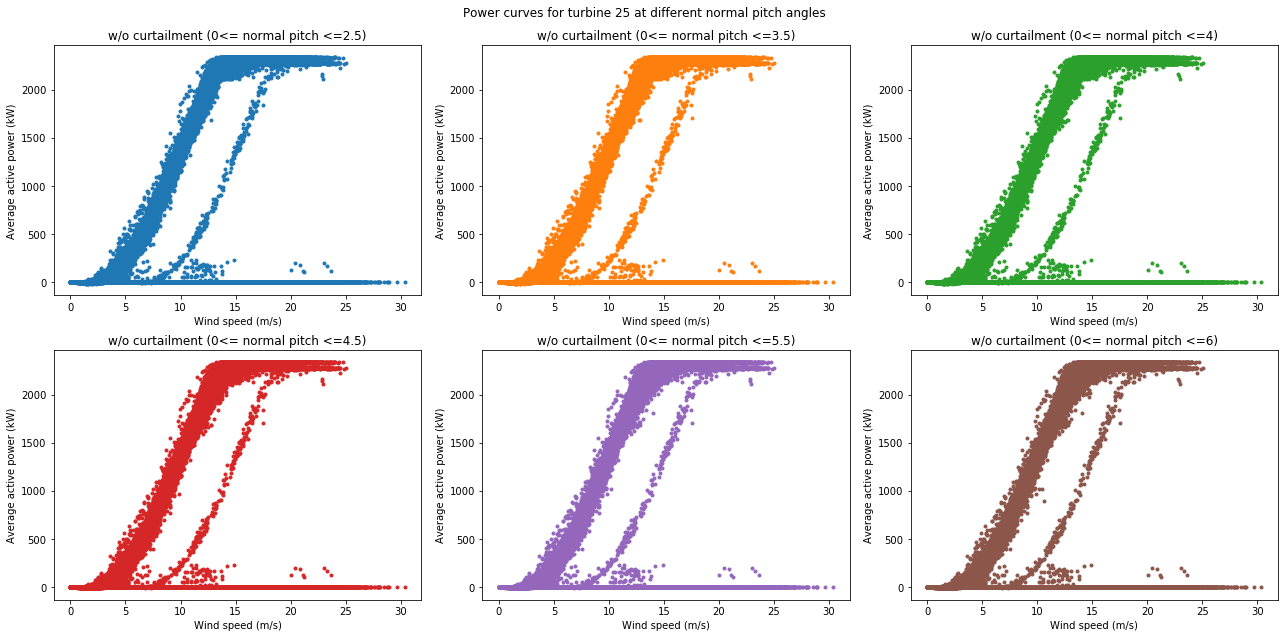
# plot for pitch angle = 2.5, 3.5, 4, 4.5, 5.5 and 6 deg
for x in list1:
    dfx = df[(df["turbine"] == x)].copy()

    # 2.5 deg
    def f5(c):
        if 0 <= c["pitch"] <= 2.5 or (
            (c["pitch"] > 2.5 or c["pitch"] < 0)
            and (
                c["ap_av"] <= (0.1 * dfx["ap_av"].max())
                or c["ap_av"] >= (0.9 * dfx["ap_av"].max())
            )
        ):
            return "normal"
        else:
            return "curtailed"

    dfx["curtailment5"] = dfx.apply(f5, axis=1)

    # 3.5 deg
    def f6(c):
        if 0 <= c["pitch"] <= 3.5 or (
            (c["pitch"] > 3.5 or c["pitch"] < 0)
            and (
                c["ap_av"] <= (0.1 * dfx["ap_av"].max())
                or c["ap_av"] >= (0.9 * dfx["ap_av"].max())
            )
        ):
            return "normal"
        else:
            return "curtailed"

    dfx["curtailment6"] = dfx.apply(f6, axis=1)

    # 4 deg
    def f7(c):
        if 0 <= c["pitch"] <= 4 or (
            (c["pitch"] > 4 or c["pitch"] < 0)
            and (
                c["ap_av"] <= (0.1 * dfx["ap_av"].max())
                or c["ap_av"] >= (0.9 * dfx["ap_av"].max())
            )
        ):
            return "normal"
        else:
            return "curtailed"

    dfx["curtailment7"] = dfx.apply(f7, axis=1)

    # 4.5 deg
    def f8(c):
        if 0 <= c["pitch"] <= 4.5 or (
            (c["pitch"] > 4.5 or c["pitch"] < 0)
            and (
                c["ap_av"] <= (0.1 * dfx["ap_av"].max())
                or c["ap_av"] >= (0.9 * dfx["ap_av"].max())
            )
        ):
            return "normal"
        else:
            return "curtailed"

    dfx["curtailment8"] = dfx.apply(f8, axis=1)

    # 5.5 deg
    def f9(c):
        if 0 <= c["pitch"] <= 5.5 or (
            (c["pitch"] > 5.5 or c["pitch"] < 0)
            and (
                c["ap_av"] <= (0.1 * dfx["ap_av"].max())
                or c["ap_av"] >= (0.9 * dfx["ap_av"].max())
            )
        ):
            return "normal"
        else:
            return "curtailed"

    dfx["curtailment9"] = dfx.apply(f9, axis=1)

    # 6 deg
    def f10(c):
        if 0 <= c["pitch"] <= 6 or (
            (c["pitch"] > 6 or c["pitch"] < 0)
            and (
                c["ap_av"] <= (0.1 * dfx["ap_av"].max())
                or c["ap_av"] >= (0.9 * dfx["ap_av"].max())
            )
        ):
            return "normal"
        else:
            return "curtailed"

    dfx["curtailment10"] = dfx.apply(f10, axis=1)

    # normal w/o curtailment 2.5 deg
    df1 = dfx[dfx.curtailment5 == "normal"]
    # normal w/o curtailment 3.5 deg
    df2 = dfx[dfx.curtailment6 == "normal"]
    # normal w/o curtailment 4 deg
    df3 = dfx[dfx.curtailment7 == "normal"]
    # normal w/o curtailment 4.5 deg
    df4 = dfx[dfx.curtailment8 == "normal"]
    # normal w/o curtailment 5.5 deg
    df5 = dfx[dfx.curtailment9 == "normal"]
    # normal w/o curtailment 6 deg
    df6 = dfx[dfx.curtailment10 == "normal"]

    # normal w/o curtailment 2.5 deg pitch
    x1 = df1["ws_av"]
    y1 = df1["ap_av"]
    # normal w/o curtailment 3.5 deg
    x2 = df2["ws_av"]
    y2 = df2["ap_av"]
    # normal w/o curtailment 4 deg
    x3 = df3["ws_av"]
    y3 = df3["ap_av"]
    # normal w/o curtailment 4.5 deg
    x4 = df4["ws_av"]
    y4 = df4["ap_av"]
    # normal w/o curtailment 5.5 deg
    x5 = df5["ws_av"]
    y5 = df5["ap_av"]
    # normal w/o curtailment 6 deg
    x6 = df6["ws_av"]
    y6 = df6["ap_av"]

    fig = plt.figure(figsize=(18, 9), dpi=1500)

    ax1 = fig.add_subplot(231)
    ax1.scatter(x1, y1, marker=".", c="C0")
    plt.xlabel("Wind speed (m/s)")
    plt.ylabel("Average active power (kW)")
    plt.title("w/o curtailment (0<= normal pitch <=2.5)")

    ax2 = fig.add_subplot(232)
    ax2.scatter(x2, y2, marker=".", c="C1")
    plt.xlabel("Wind speed (m/s)")
    plt.ylabel("Average active power (kW)")
    plt.title("w/o curtailment (0<= normal pitch <=3.5)")

    ax3 = fig.add_subplot(233)
    ax3.scatter(x3, y3, marker=".", c="C2")
    plt.xlabel("Wind speed (m/s)")
    plt.ylabel("Average active power (kW)")
    plt.title("w/o curtailment (0<= normal pitch <=4)")

    ax4 = fig.add_subplot(234)
    ax4.scatter(x4, y4, marker=".", c="C3")
    plt.xlabel("Wind speed (m/s)")
    plt.ylabel("Average active power (kW)")
    plt.title("w/o curtailment (0<= normal pitch <=4.5)")

    ax5 = fig.add_subplot(235)
    ax5.scatter(x5, y5, marker=".", c="C4")
    plt.xlabel("Wind speed (m/s)")
    plt.ylabel("Average active power (kW)")
    plt.title("w/o curtailment (0<= normal pitch <=5.5)")

    ax6 = fig.add_subplot(236)
    ax6.scatter(x6, y6, marker=".", c="C5")
    plt.xlabel("Wind speed (m/s)")
    plt.ylabel("Average active power (kW)")
    plt.title("w/o curtailment (0<= normal pitch <=6)")

    fig.suptitle(
        "Power curves for turbine %s" % x + " at different normal pitch angles"
    )
    plt.tight_layout()
    plt.subplots_adjust(top=0.92)
    plt.show()
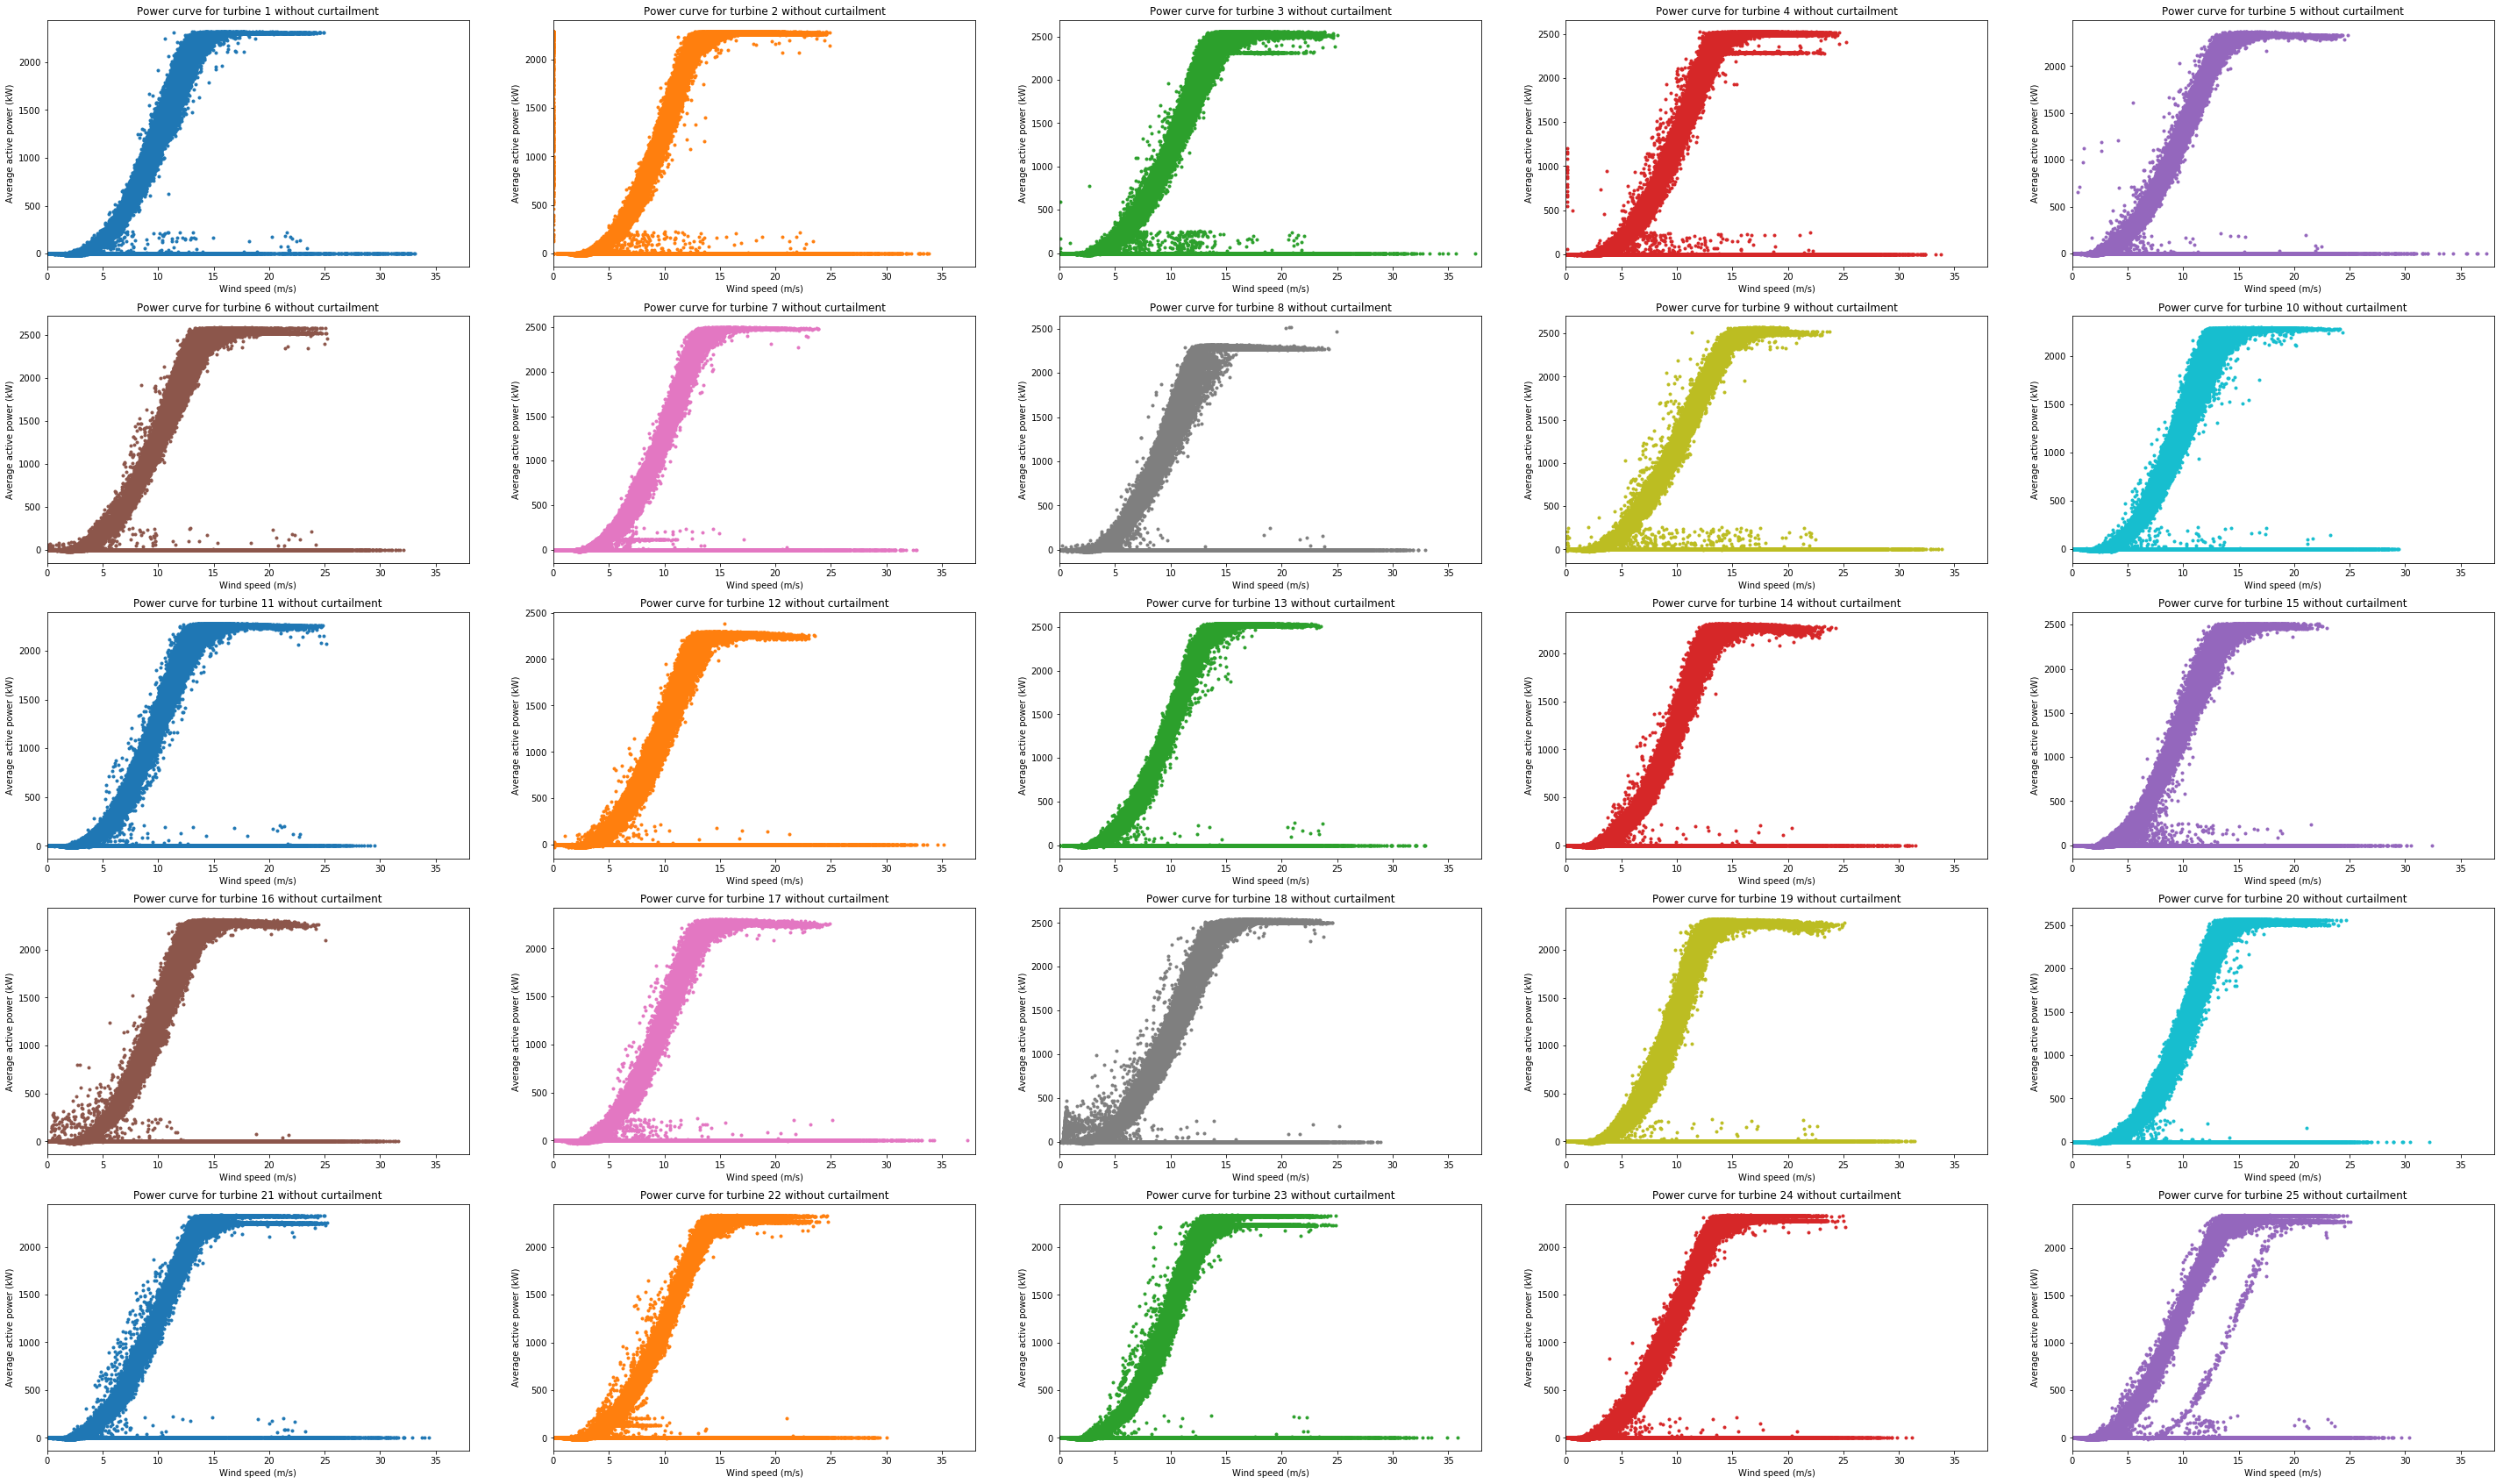
# plot for all turbines with a threshold of 3.5 deg
# list of turbines to plot
list2 = list(df["turbine"].unique())
# sort turbines in ascending order
list2 = sorted(list2, key=int)
# create new empty dataframe with the same index
df2 = pd.DataFrame(index=df.index)
# apply function for filtering curtailment
for x in list2:
    dfx = df[(df["turbine"] == x)].copy()

    # 3.5 deg
    def f(c):
        if 0 <= c["pitch"] <= 3.5 or (
            (c["pitch"] > 3.5 or c["pitch"] < 0)
            and (
                c["ap_av"] <= (0.1 * dfx["ap_av"].max())
                or c["ap_av"] >= (0.9 * dfx["ap_av"].max())
            )
        ):
            return c["ap_av"]

    df2["%s" % x] = dfx.apply(f, axis=1)
# copy wind speed from original dataframe
df2["Wind speed (m/s)"] = df["ws_av"]
# setting wind speed as index
df2 = df2.set_index("Wind speed (m/s)")
# create new list for individual subplot titles
list3 = ["Power curve for turbine %s without curtailment" % x for x in list2]
# plotting all columns (all turbines) in the same figure
ax = df2.plot(
    subplots=True,
    style=".",
    layout=(5, 5),
    figsize=(50, 30),
    sharex=False,
    title=list3,
    legend=False,
    xlim=(0, 38),
)
# based on layout=(x, y), create lists with range(0, x) and (0, y)
list4 = list(range(0, 5))
# get coordinates of each subplot
list5 = list(itertools.product(list4, list4))
for x, y in list5:
    ax[x][y].set_ylabel("Average active power (kW)")
# frequency of pitch angles
# round pitch angle to nearest degree
df["pitch_round"] = df["pitch"].round()
dfg = pd.DataFrame(df.groupby("pitch_round").size())
dfg = dfg.sort_values([0], ascending=False)
# get percentage of frequency of pitch angle
dfg["pct"] = dfg[0] / dfg[0].sum() * 100
dfg
| 0 | pct | |
|---|---|---|
| pitch_round | ||
| 0.0 | 1860480 | 58.711186 |
| 70.0 | 276033 | 8.710776 |
| 87.0 | 168835 | 5.327928 |
| 1.0 | 113249 | 3.573800 |
| 90.0 | 80266 | 2.532955 |
| 2.0 | 54123 | 1.707960 |
| 91.0 | 53477 | 1.687574 |
| 92.0 | 36593 | 1.154766 |
| 3.0 | 34269 | 1.081427 |
| 4.0 | 27782 | 0.876717 |
| 5.0 | 24818 | 0.783182 |
| 6.0 | 23143 | 0.730324 |
| 8.0 | 22213 | 0.700976 |
| 7.0 | 22092 | 0.697157 |
| 9.0 | 20394 | 0.643574 |
| 10.0 | 18880 | 0.595796 |
| 11.0 | 17655 | 0.557139 |
| 12.0 | 16467 | 0.519649 |
| 13.0 | 15673 | 0.494593 |
| 14.0 | 14167 | 0.447068 |
| 15.0 | 12921 | 0.407748 |
| 16.0 | 11359 | 0.358456 |
| 17.0 | 9592 | 0.302695 |
| 18.0 | 8804 | 0.277828 |
| 89.0 | 7998 | 0.252393 |
| 19.0 | 6905 | 0.217901 |
| 61.0 | 6867 | 0.216702 |
| 60.0 | 6834 | 0.215661 |
| 22.0 | 6385 | 0.201492 |
| 20.0 | 6065 | 0.191393 |
| ... | ... | ... |
| 281.0 | 1 | 0.000032 |
| -160.0 | 1 | 0.000032 |
| 288.0 | 1 | 0.000032 |
| -175.0 | 1 | 0.000032 |
| -185.0 | 1 | 0.000032 |
| -202.0 | 1 | 0.000032 |
| 307.0 | 1 | 0.000032 |
| 239.0 | 1 | 0.000032 |
| 229.0 | 1 | 0.000032 |
| -101.0 | 1 | 0.000032 |
| -65.0 | 1 | 0.000032 |
| -6.0 | 1 | 0.000032 |
| -9.0 | 1 | 0.000032 |
| -10.0 | 1 | 0.000032 |
| -22.0 | 1 | 0.000032 |
| -24.0 | 1 | 0.000032 |
| -29.0 | 1 | 0.000032 |
| -57.0 | 1 | 0.000032 |
| -60.0 | 1 | 0.000032 |
| -68.0 | 1 | 0.000032 |
| 233.0 | 1 | 0.000032 |
| -73.0 | 1 | 0.000032 |
| 221.0 | 1 | 0.000032 |
| -89.0 | 1 | 0.000032 |
| -93.0 | 1 | 0.000032 |
| 228.0 | 1 | 0.000032 |
| -96.0 | 1 | 0.000032 |
| -99.0 | 1 | 0.000032 |
| 232.0 | 1 | 0.000032 |
| 327.0 | 1 | 0.000032 |
351 rows × 2 columns
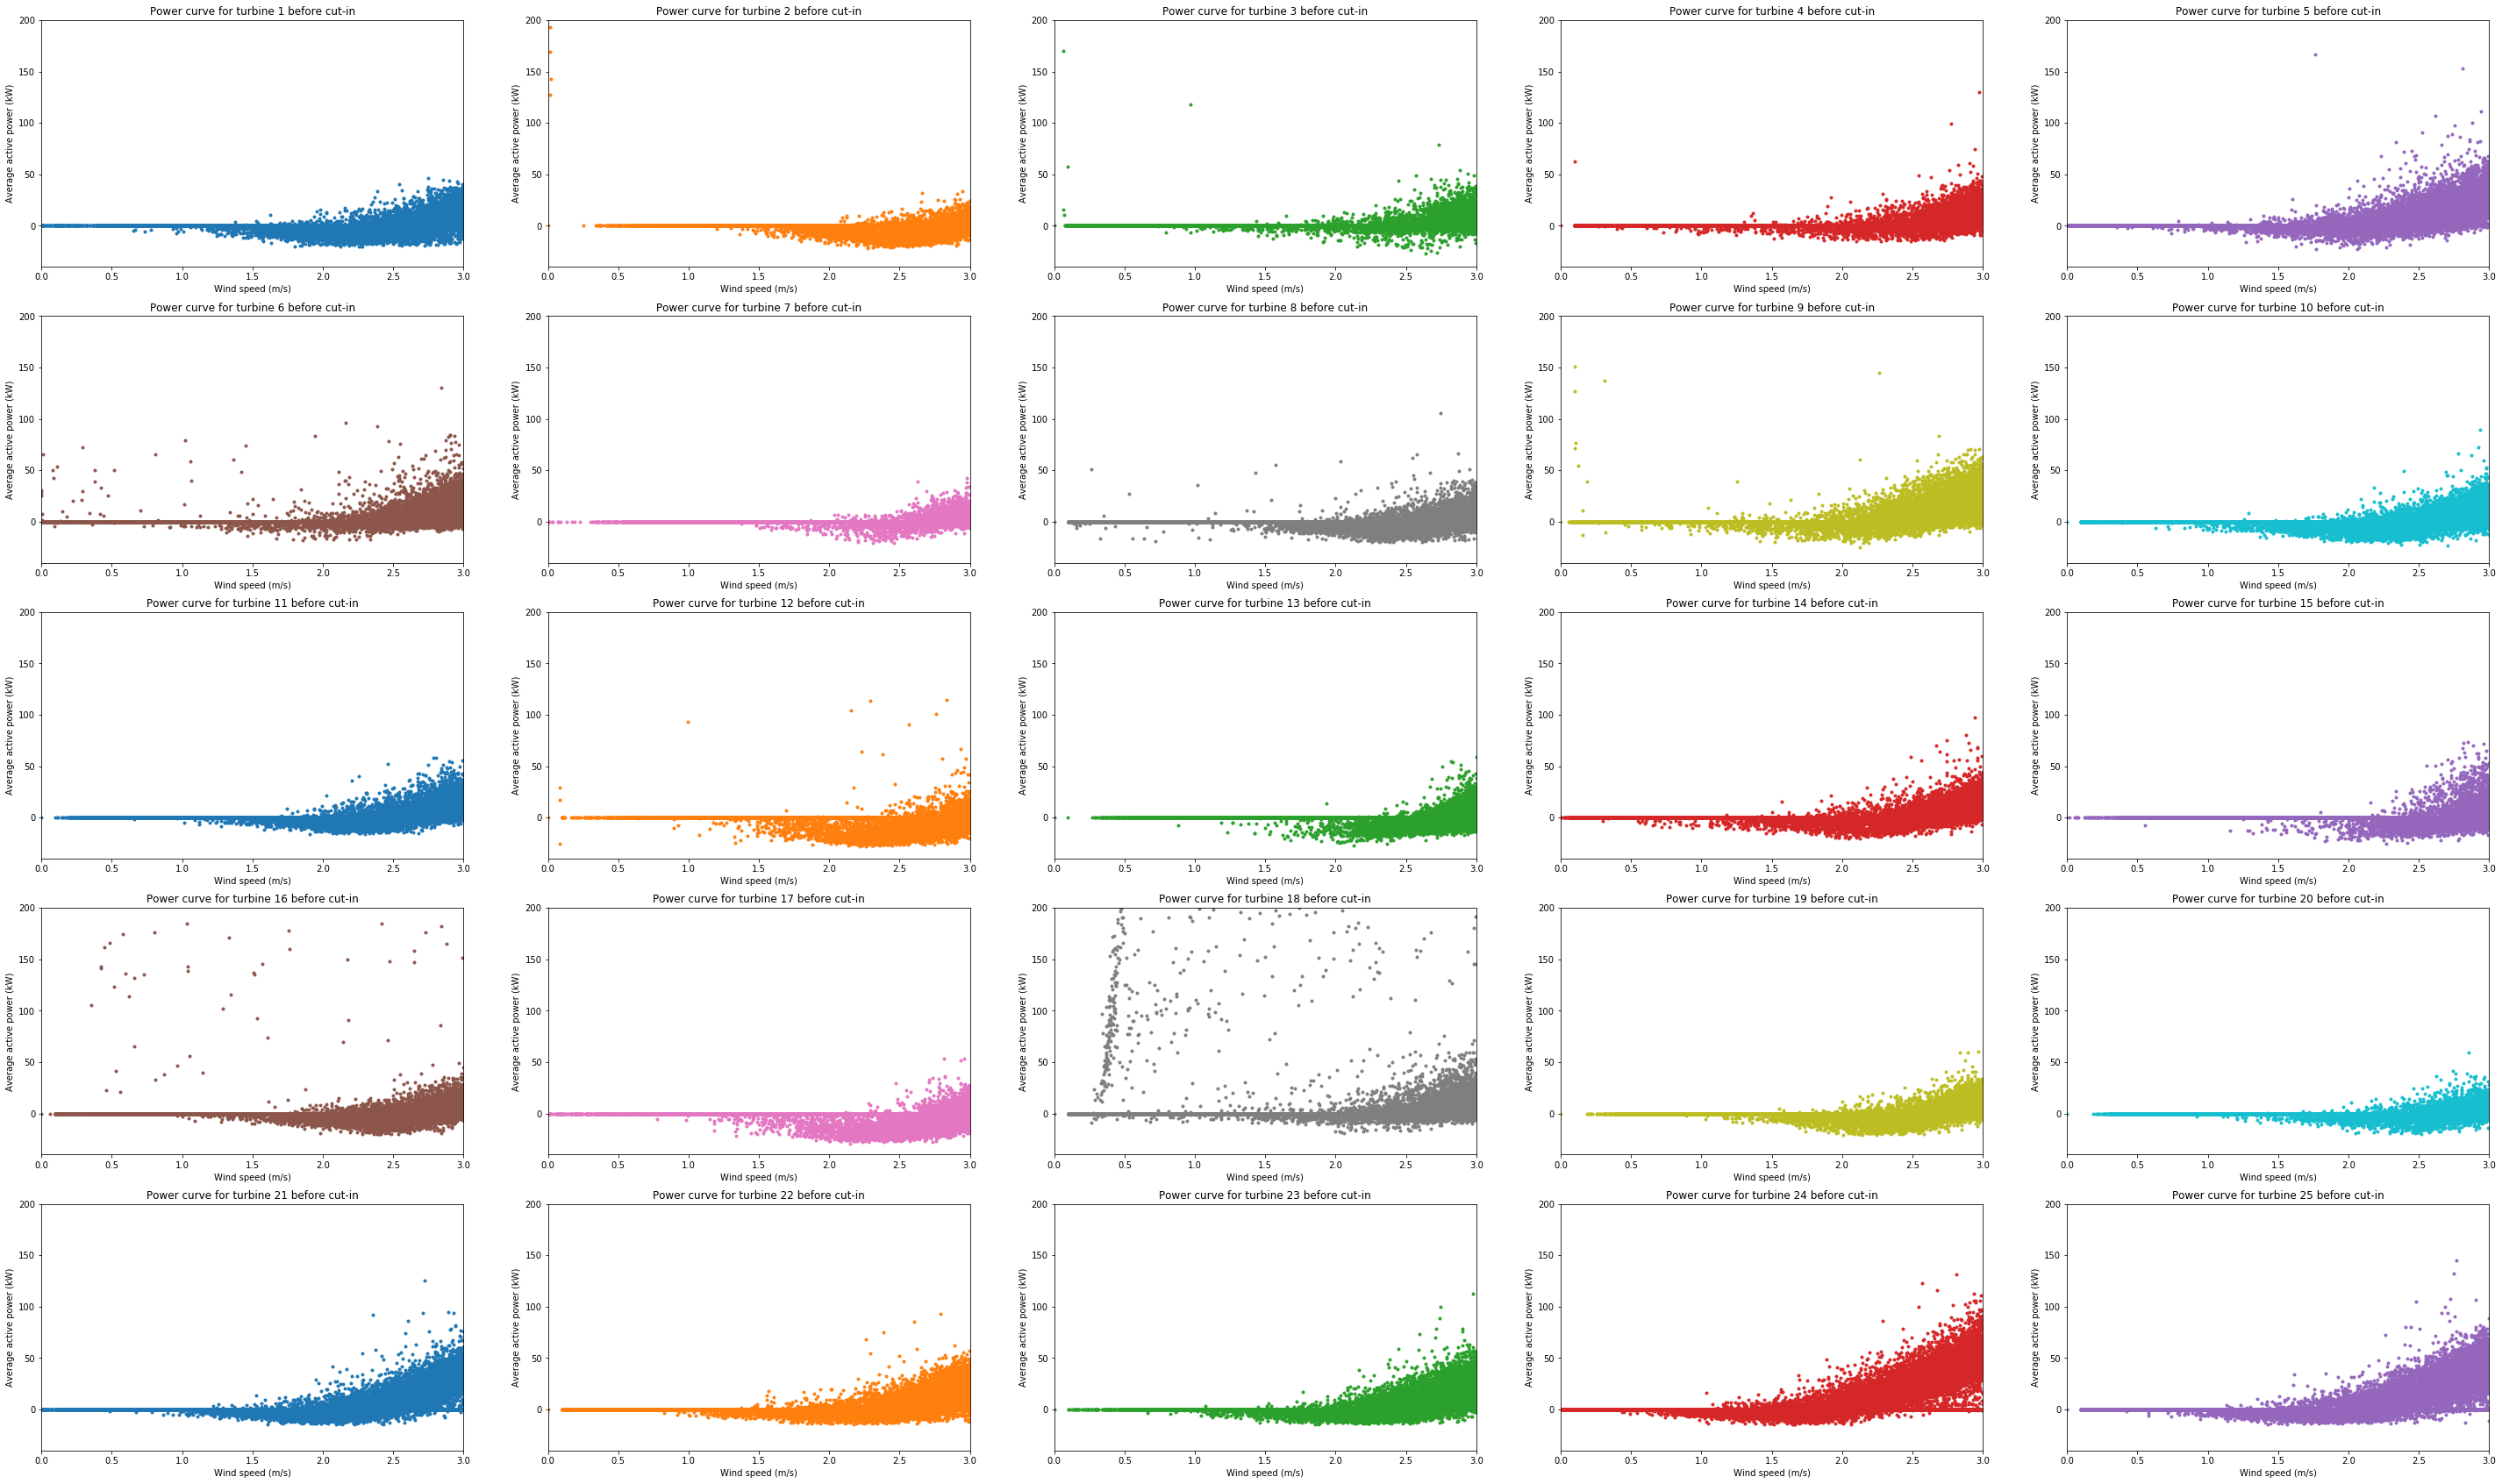
# finding power threshold before cut-in
# extract power readings before cut-in (3m/s)


def f_(c):
    if c["ws_av"] <= 3:
        return c["ap_av"]


df["power"] = df.apply(f_, axis=1)
# create pivot table (new dataframe)
p = pd.pivot_table(df, index=["ws_av"], columns=["turbine"], values=["power"])
# removing pivot table values name from heading
p.columns = p.columns.droplevel(0)
list6 = ["Power curve for turbine %s before cut-in" % x for x in list2]
# rename index
p.index.name = "Wind speed (m/s)"
ax = p.plot(
    subplots=True,
    figsize=(50, 30),
    layout=(5, 5),
    style=".",
    sharex=False,
    title=list6,
    legend=False,
    xlim=(0, 3),
    ylim=(-40, 200),
)
for x, y in list5:
    ax[x][y].set_ylabel("Average active power (kW)")
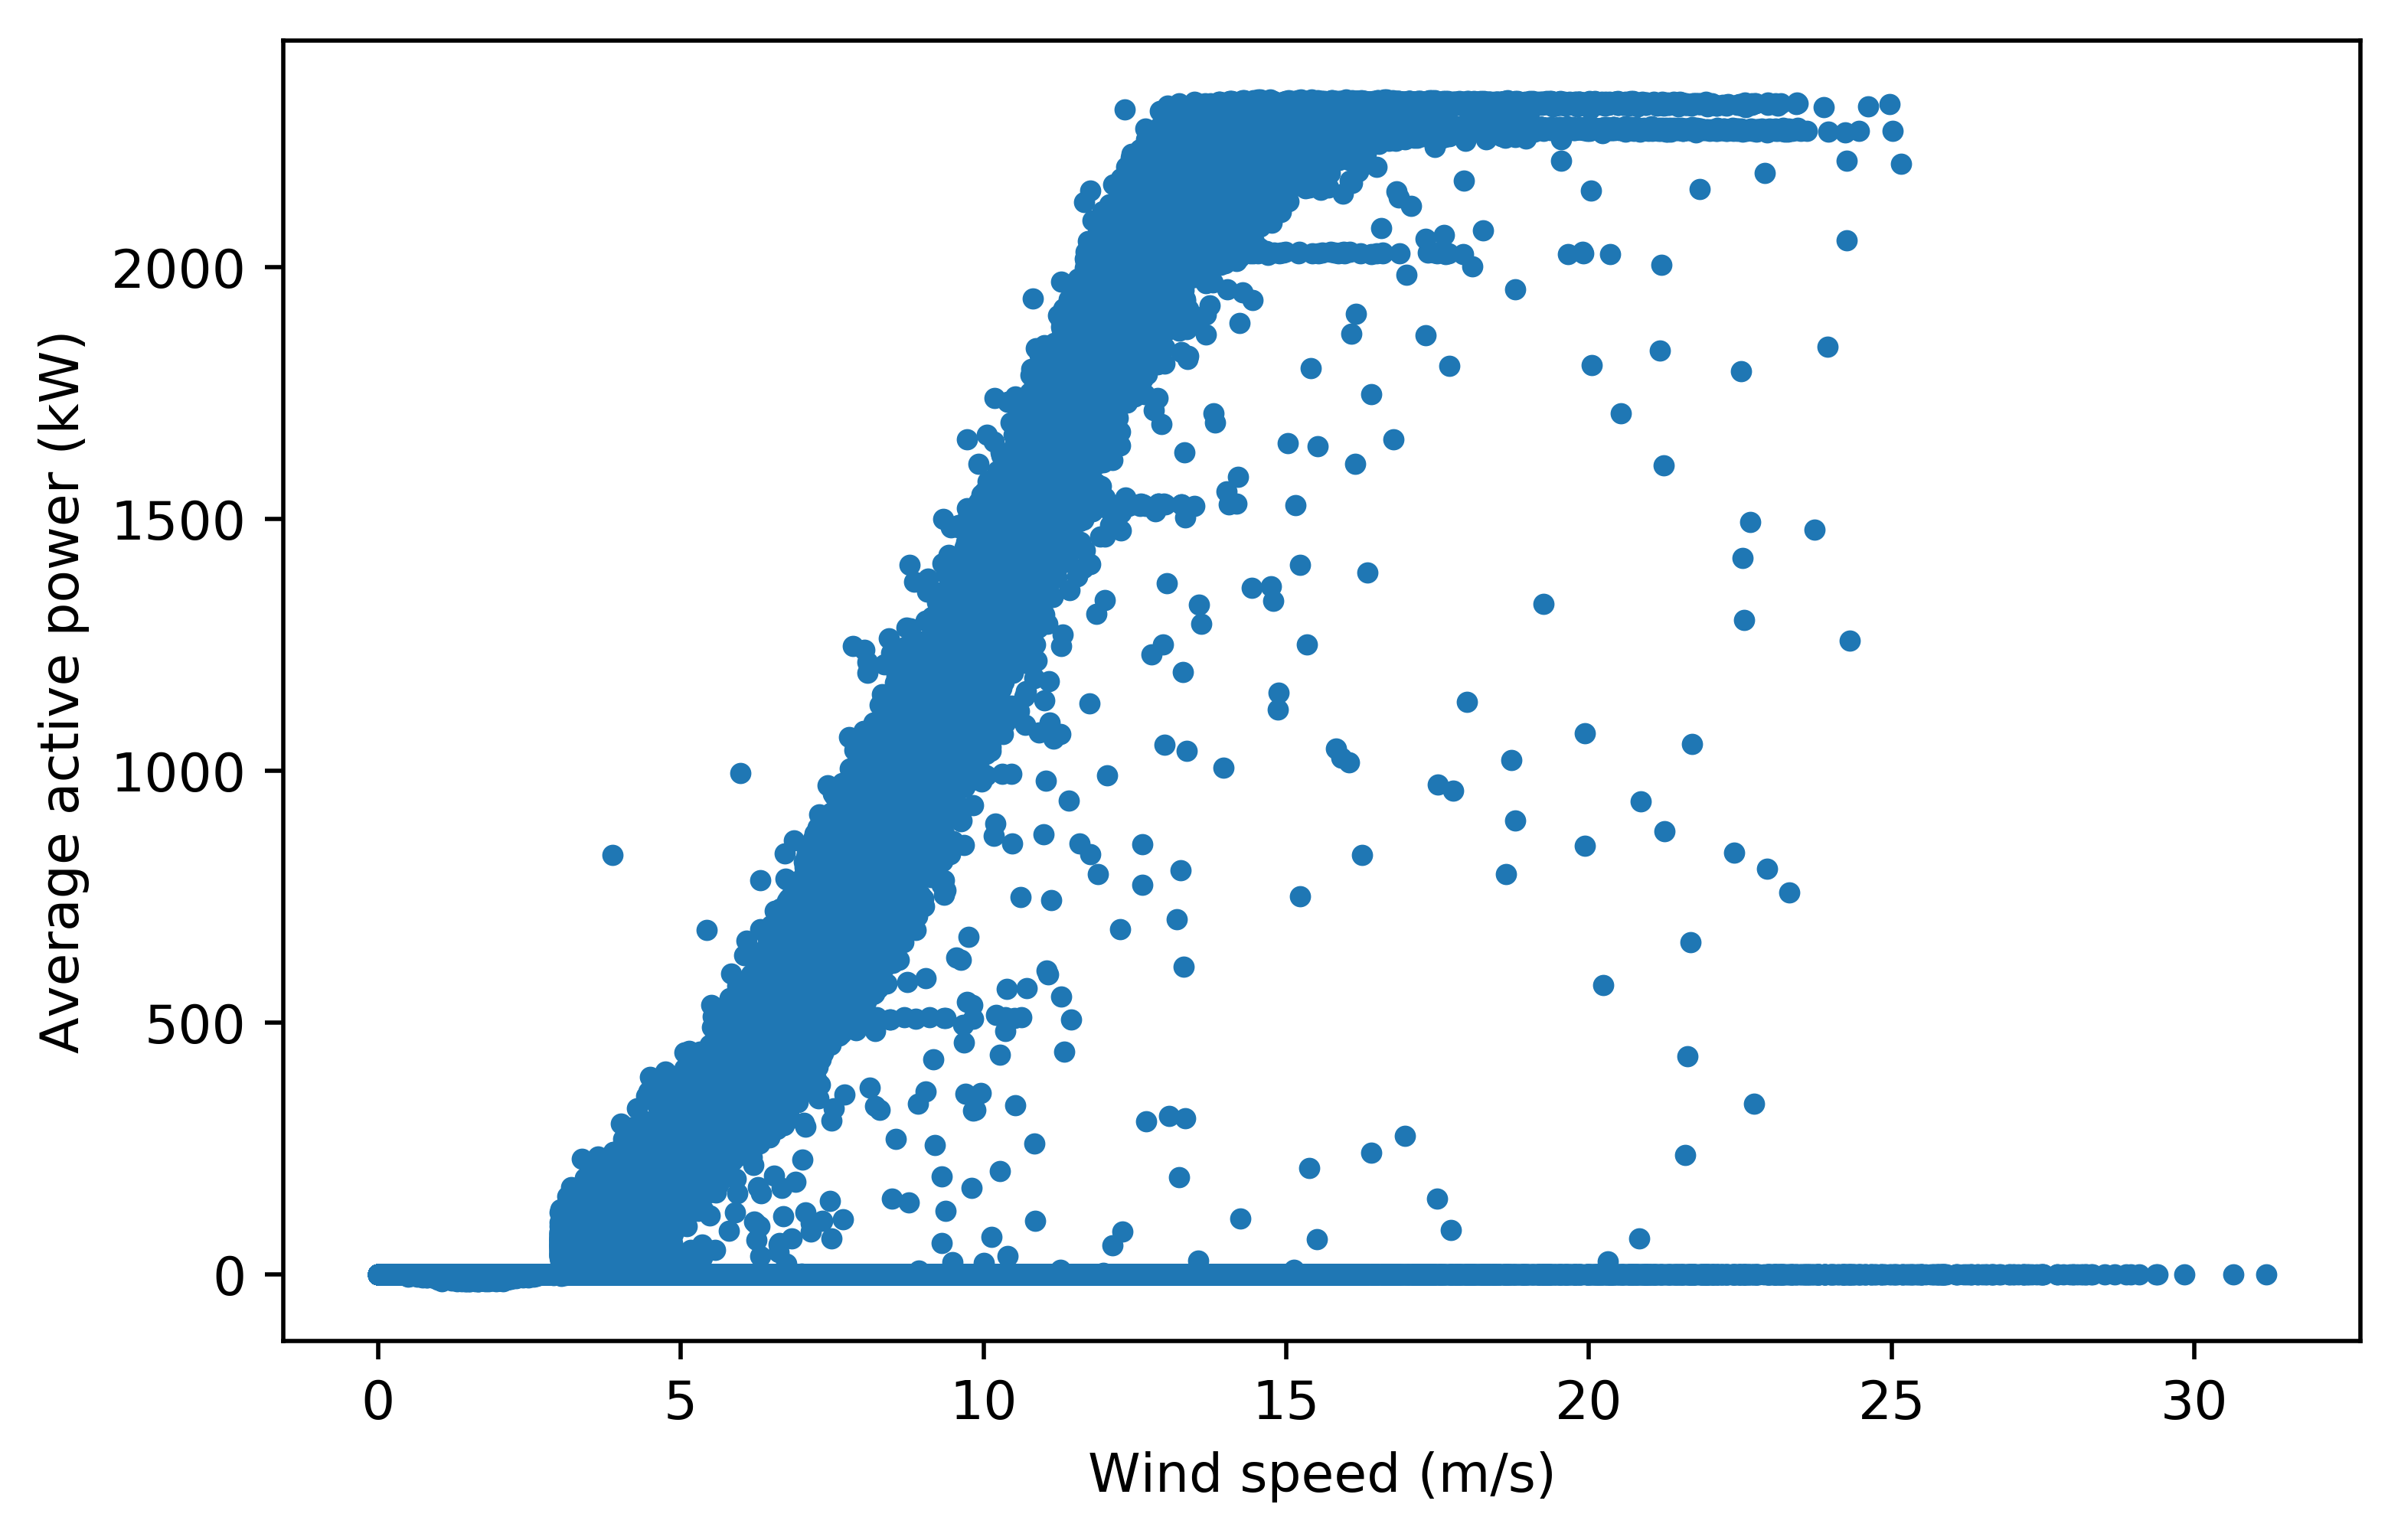
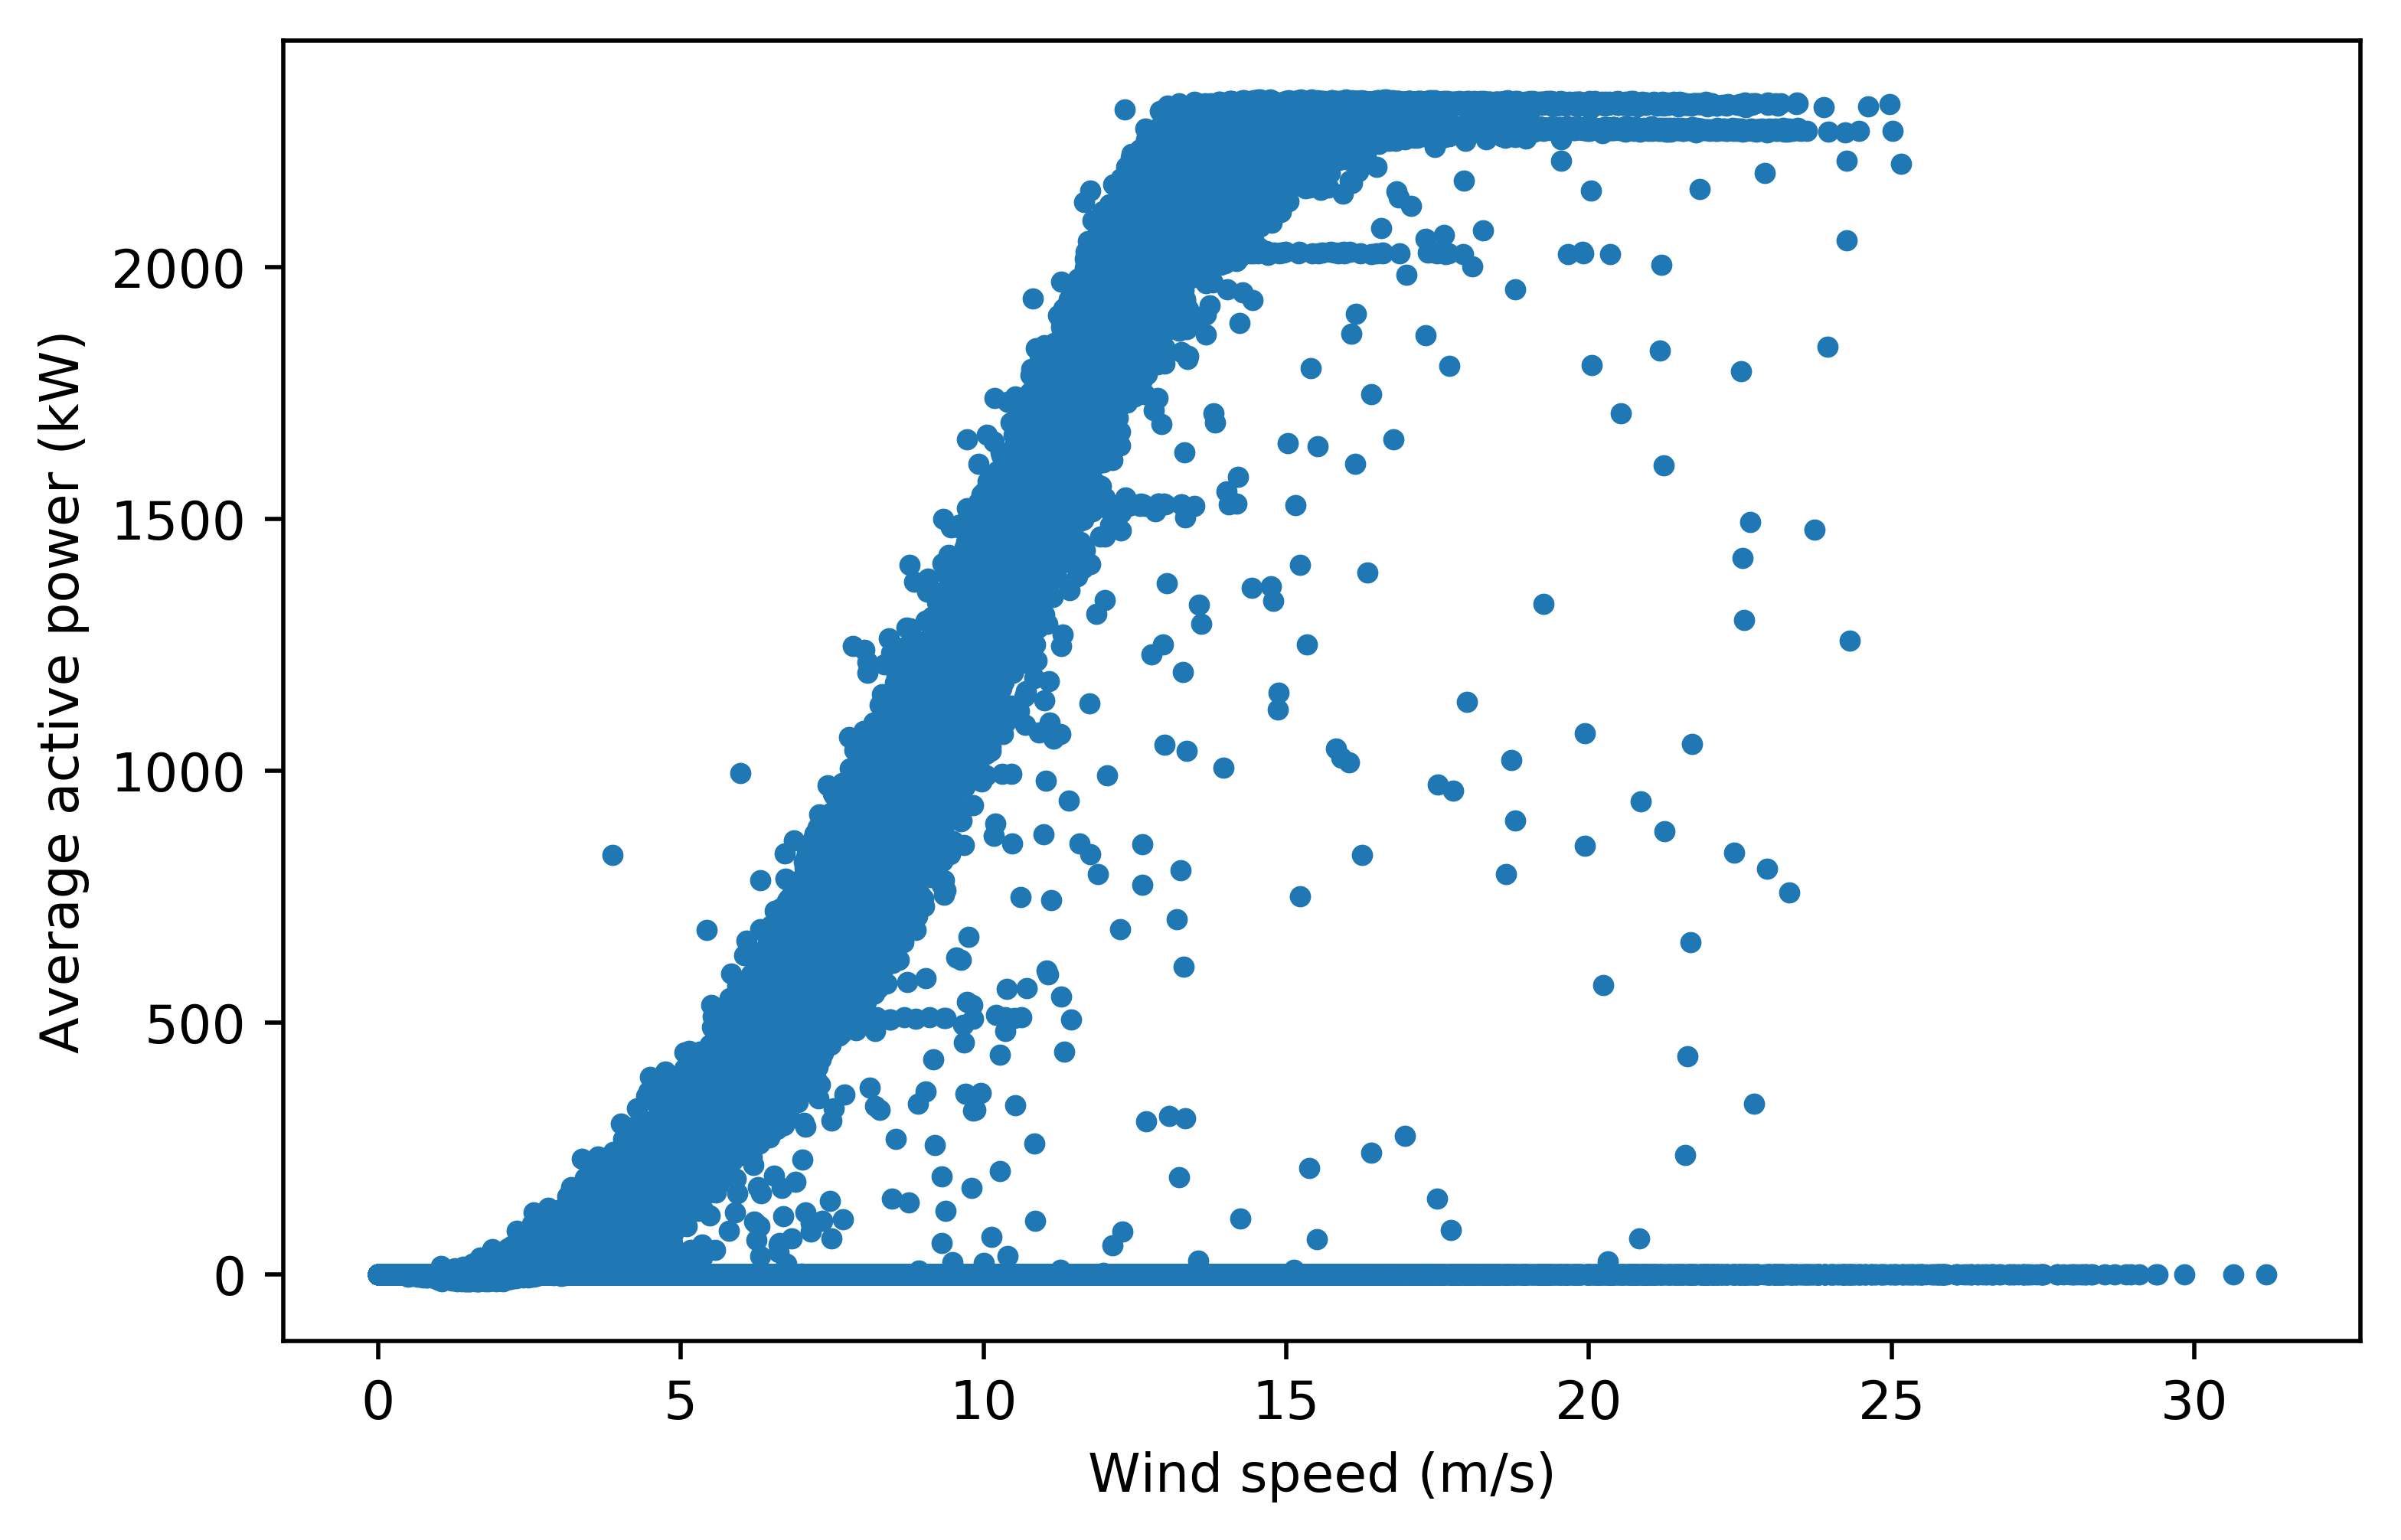
# plot for turbine 24 to visualise the difference
# list of turbines to plot
list1 = [24]
for x in list1:
    # filter only data for turbine x
    dfx = df[(df["turbine"] == x)].copy()

    # get x and y coordinates
    # normal w/ curtailment
    x1 = dfx["ws_av"]
    y1 = dfx["ap_av"]

    # plot the figure
    fig = plt.figure(figsize=(7, 4.5), dpi=500)

    ax1 = fig.add_subplot(111)
    ax1.scatter(x1, y1, marker=".", c="C0")
    plt.xlabel("Wind speed (m/s)")
    plt.ylabel("Average active power (kW)")
    plt.show()
for x in list1:
    # filter only data for turbine x
    dfx = df[(df["turbine"] == x)].copy()

    def f_x(c):
        if c["ws_av"] < 3 and c["ap_av"] > 0:
            return 0
        else:
            return c["ap_av"]

    dfx["ap"] = dfx.apply(f_x, axis=1)

    # get x and y coordinates
    # normal w/ curtailment
    x1 = dfx["ws_av"]
    y1 = dfx["ap"]

    # plot the figure
    fig = plt.figure(figsize=(7, 4.5), dpi=500)

    ax1 = fig.add_subplot(111)
    ax1.scatter(x1, y1, marker=".", c="C0")
    plt.xlabel("Wind speed (m/s)")
    plt.ylabel("Average active power (kW)")
    plt.show()