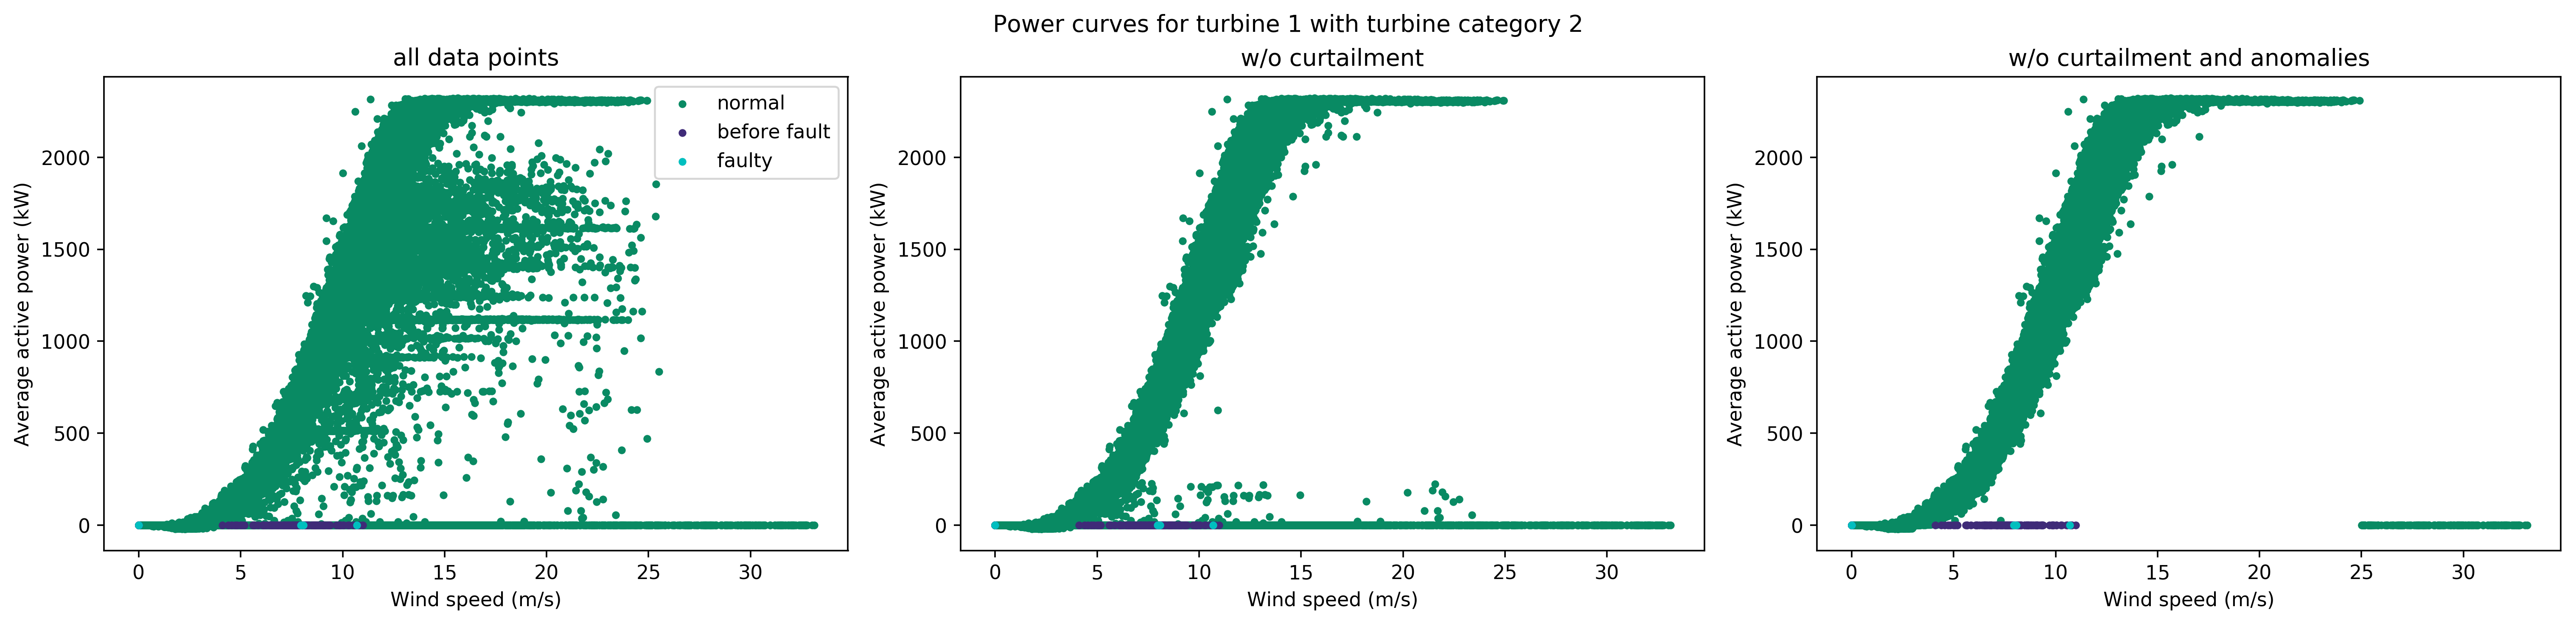
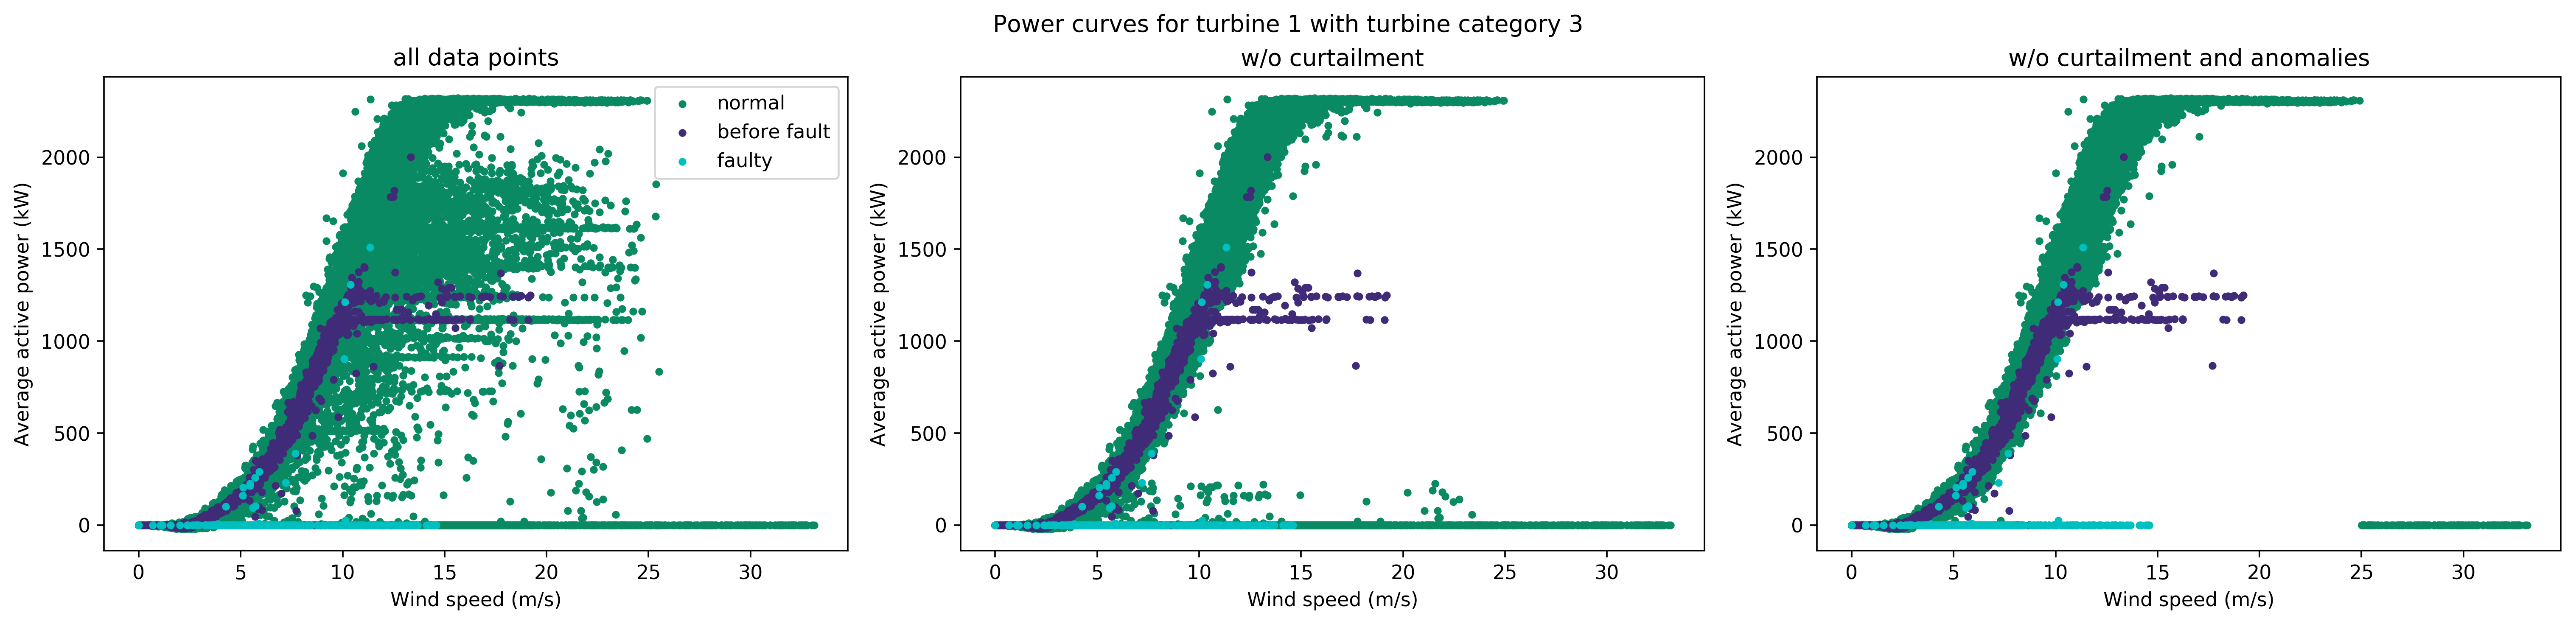
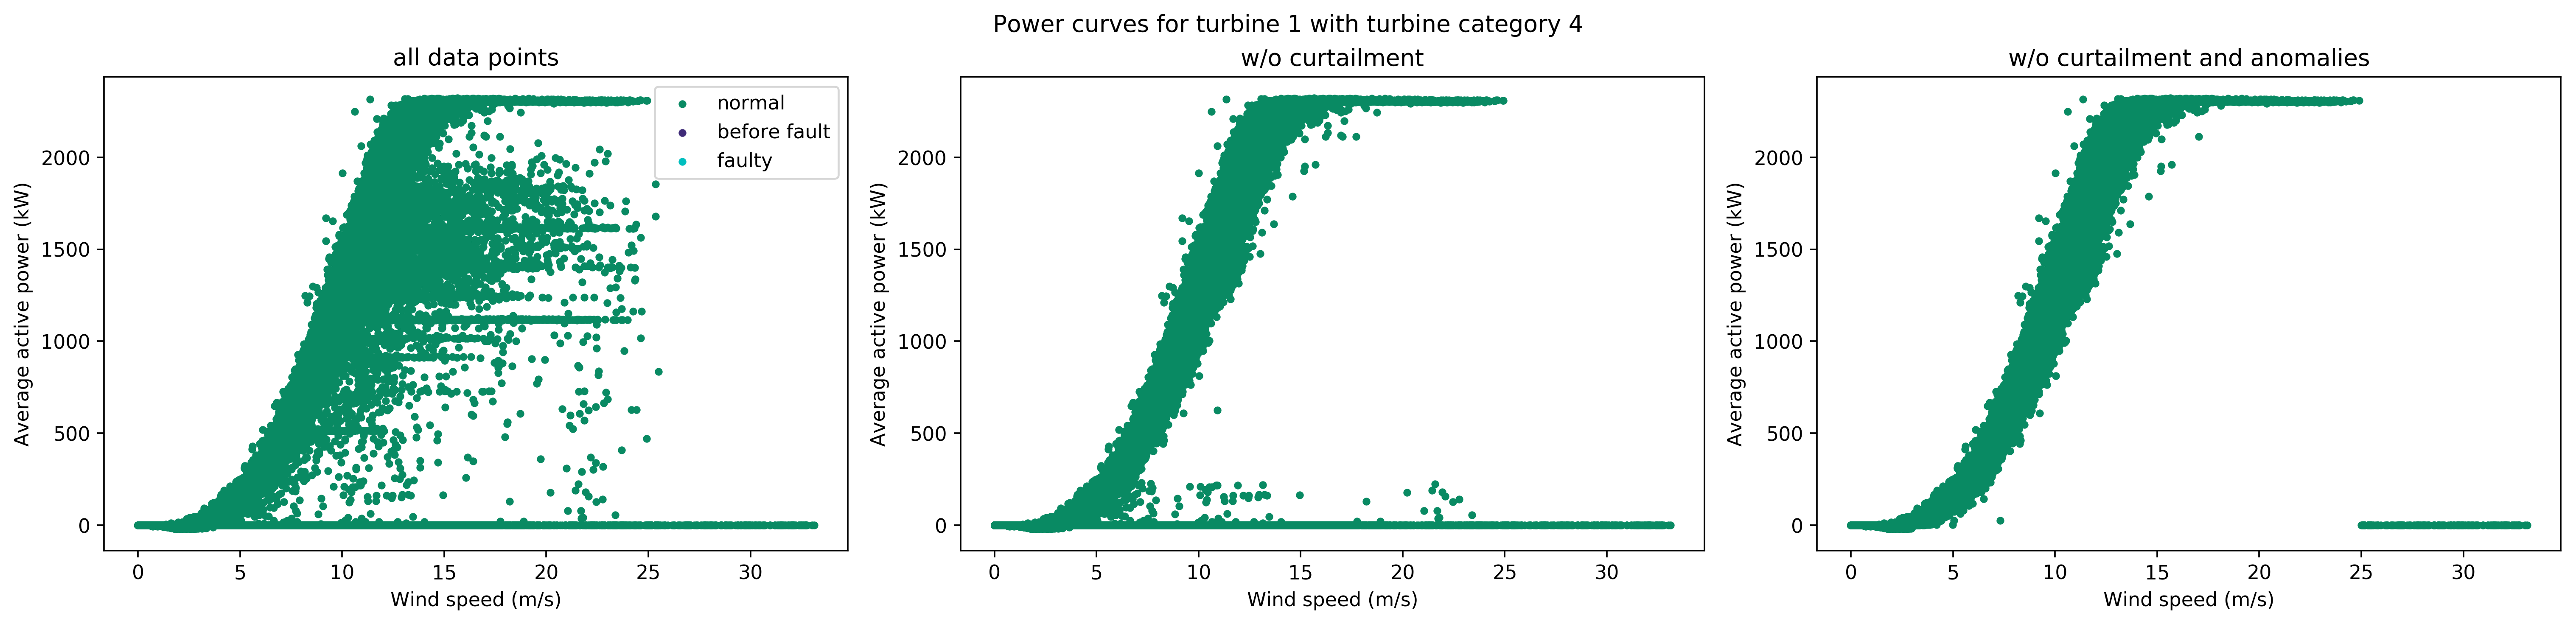
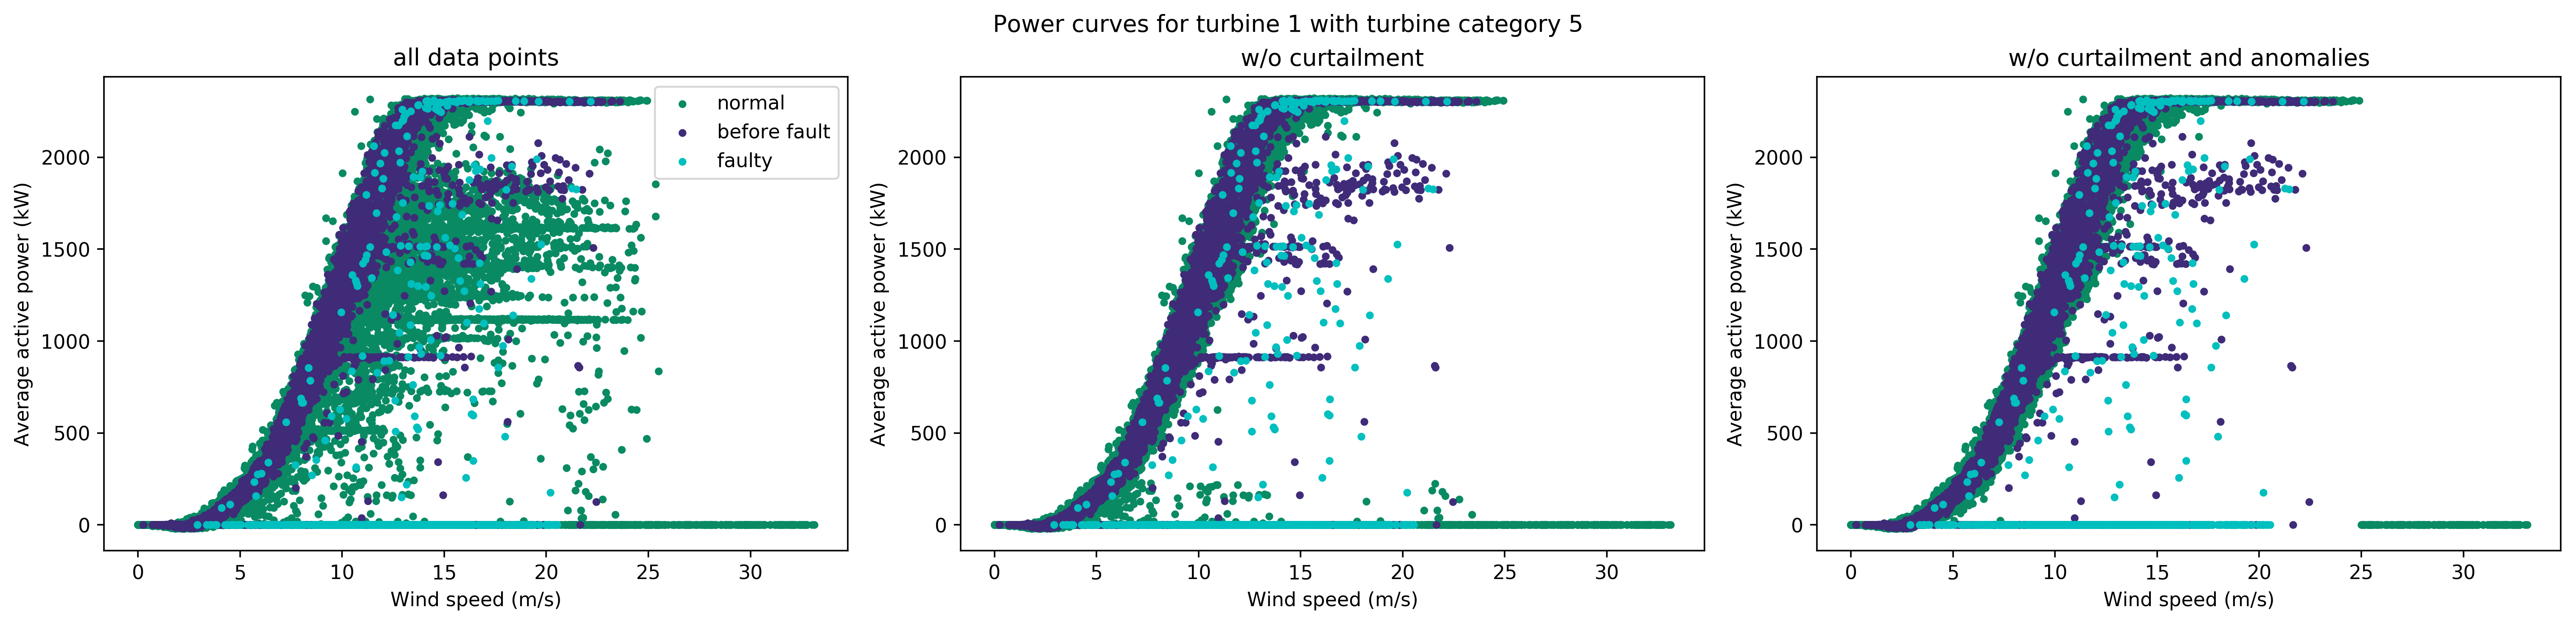
# filter only data for turbine x and plot
for x, y in list3:
df2x = df[(df["turbine_id"] == x)].copy()
# sort values by timestamp in descending order
df2x = df2x.sort_values(by="timestamp", ascending=False)
# copying fault to new column (mins)
# (fault when turbine category id is y)
def f(c):
if c["TurbineCategory_id"] == y:
return 0
else:
return 1
df2x["mins"] = df2x.apply(f, axis=1)
# reset index
df2x.reset_index(drop=True, inplace=True)
# assigning value to first cell if it's not 0
if df2x.loc[0, "mins"] == 0:
df2x.set_value(0, "mins", 0)
else:
df2x.set_value(0, "mins", 999999999)
# using previous value's row to evaluate time
for i, e in enumerate(df2x["mins"]):
if e == 1:
df2x.at[i, "mins"] = df2x.at[i - 1, "mins"] + 10
# sort in ascending order
df2x = df2x.sort_values(by="timestamp")
# reset index
df2x.reset_index(drop=True, inplace=True)
# convert to hours and round to nearest hour
df2x["hours"] = df2x["mins"].astype(np.int64)
df2x["hours"] = df2x["hours"] / 60
df2x["hours"] = round(df2x["hours"]).astype(np.int64)
# > 48 hours - label as normal (9999)
def f1(c):
if c["hours"] > 48:
return 9999
else:
return c["hours"]
df2x["hours"] = df2x.apply(f1, axis=1)
# filter out curtailment - curtailed when turbine is pitching
# outside 0 deg <= normal <= 3.5 deg
def f2(c):
if (
0 <= c["pitch"] <= 3.5
or c["hours"] != 9999
or (
(c["pitch"] > 3.5 or c["pitch"] < 0)
and (
c["ap_av"] <= (0.1 * df2x["ap_av"].max())
or c["ap_av"] >= (0.9 * df2x["ap_av"].max())
)
)
):
return "normal"
else:
return "curtailed"
df2x["curtailment"] = df2x.apply(f2, axis=1)
# filter unusual readings, i.e., for normal operation, power <= 0 in
# operating wind speeds, power > 100 before cut-in, runtime < 600
def f3(c):
if c["hours"] == 9999 and (
(
3 < c["ws_av"] < 25
and (
c["ap_av"] <= 0
or c["runtime"] < 600
or c["EnvironmentalCategory_id"] > 1
or c["GridCategory_id"] > 1
or c["InfrastructureCategory_id"] > 1
or c["AvailabilityCategory_id"] == 2
or 12 <= c["TurbineCategory_id"] <= 15
or 21 <= c["TurbineCategory_id"] <= 22
)
)
or (c["ws_av"] < 3 and c["ap_av"] > 100)
):
return "unusual"
else:
return "normal"
df2x["unusual"] = df2x.apply(f3, axis=1)
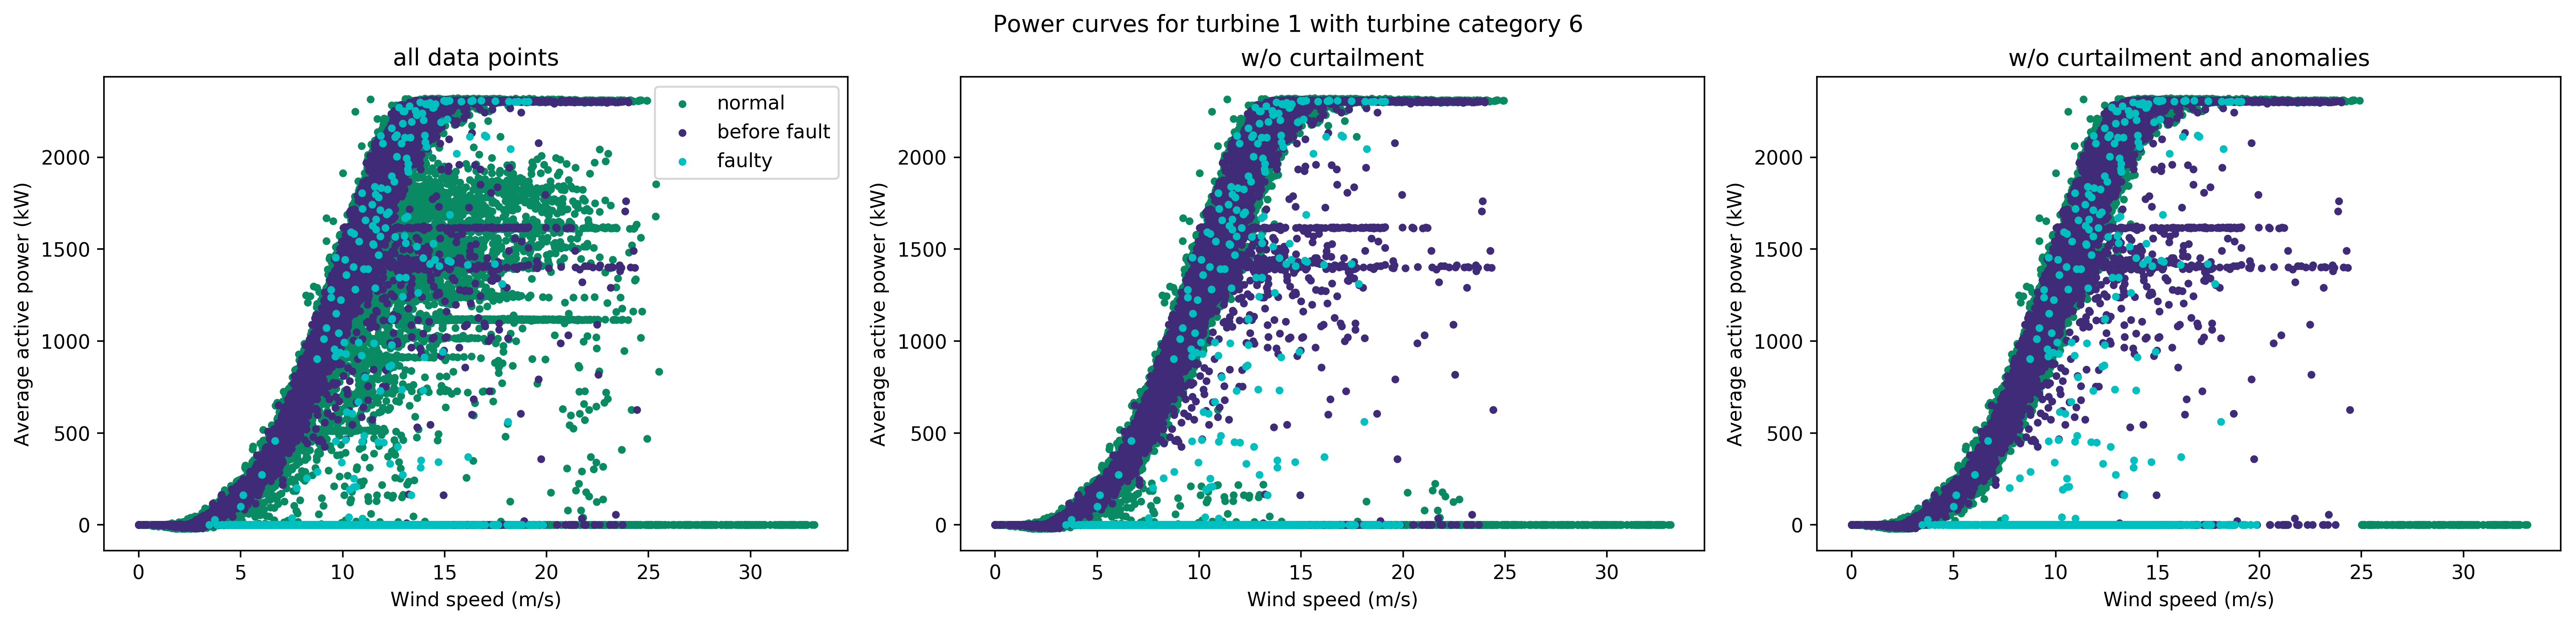
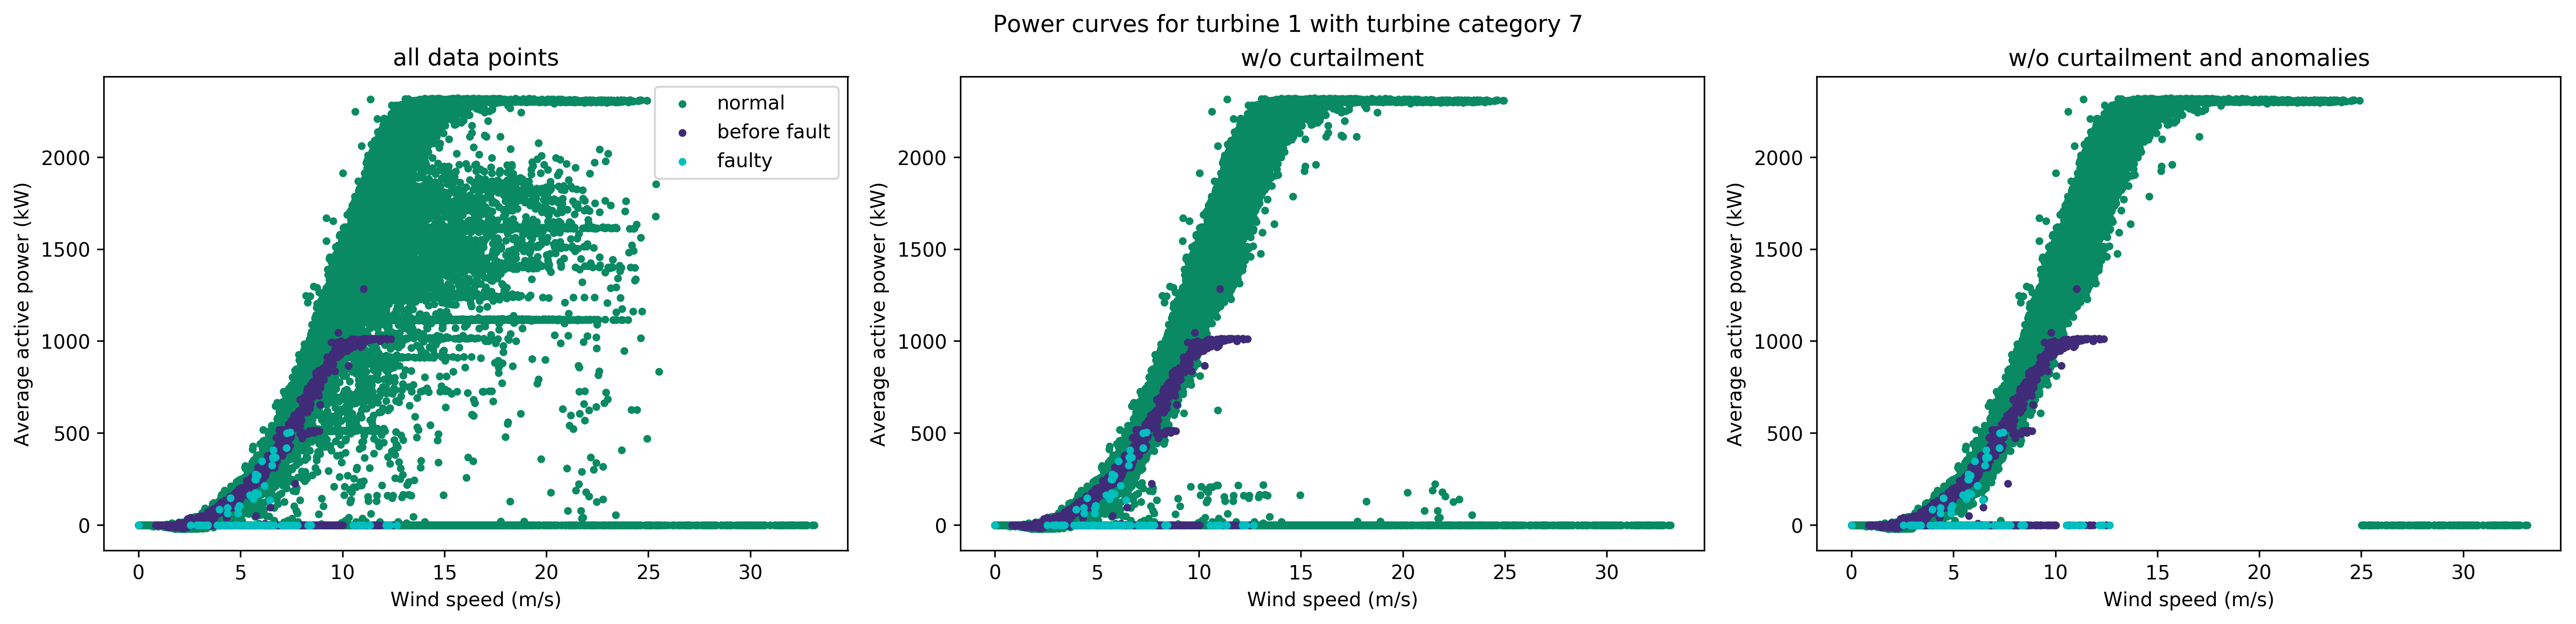
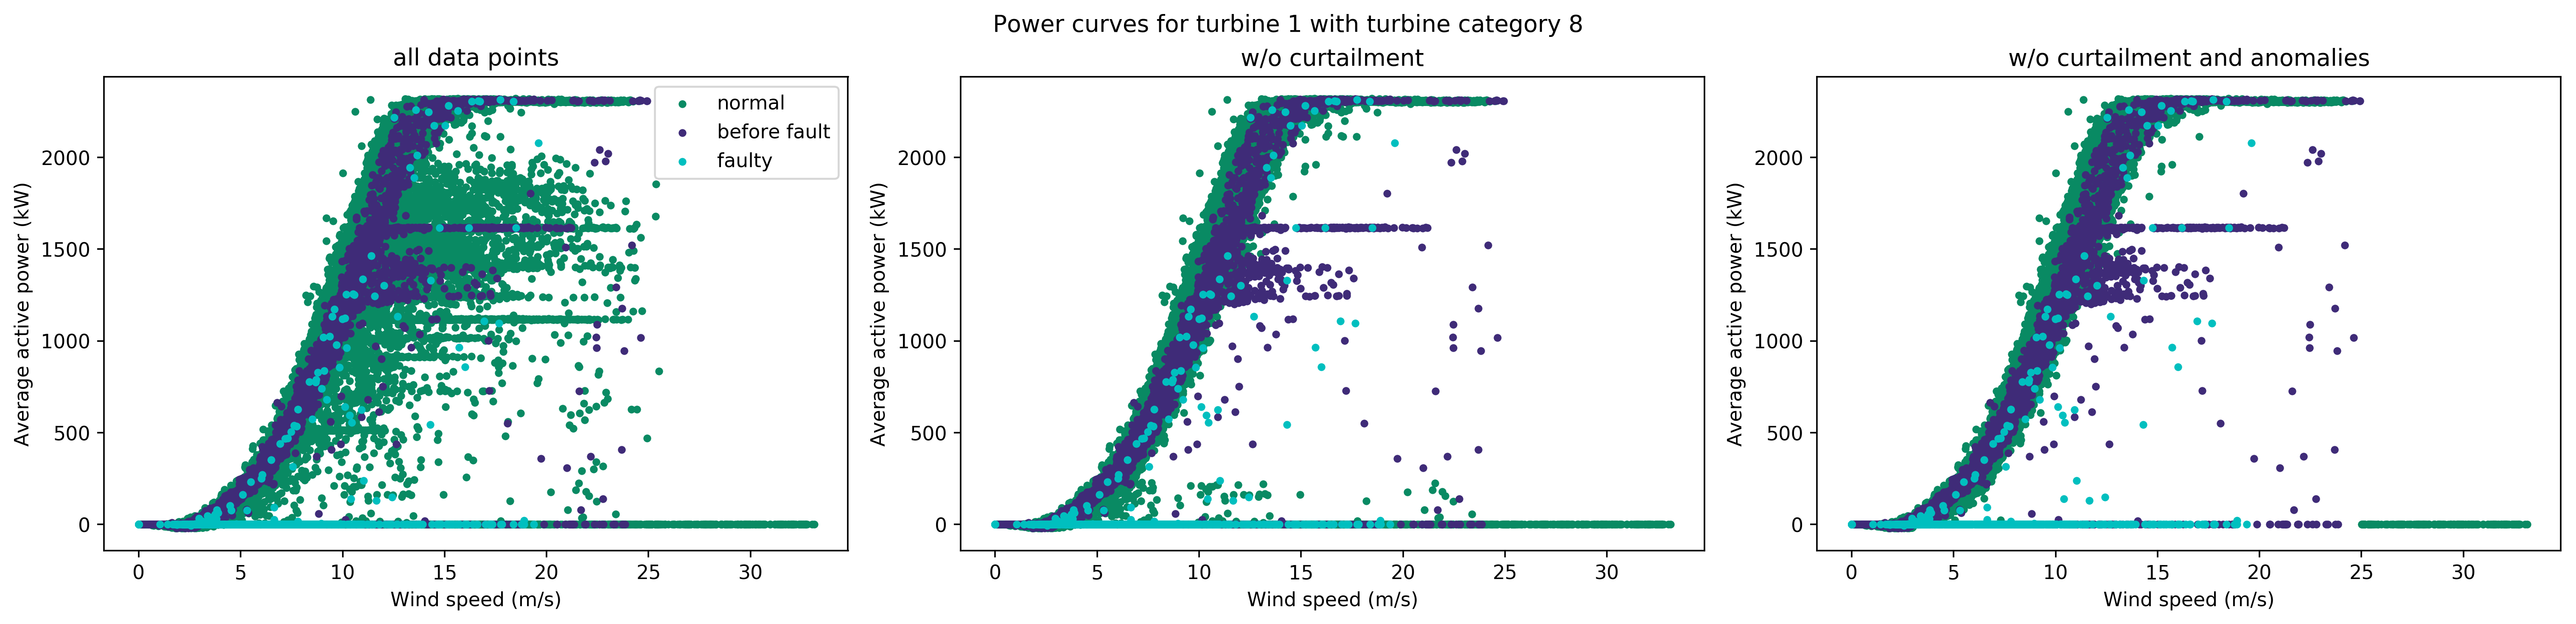
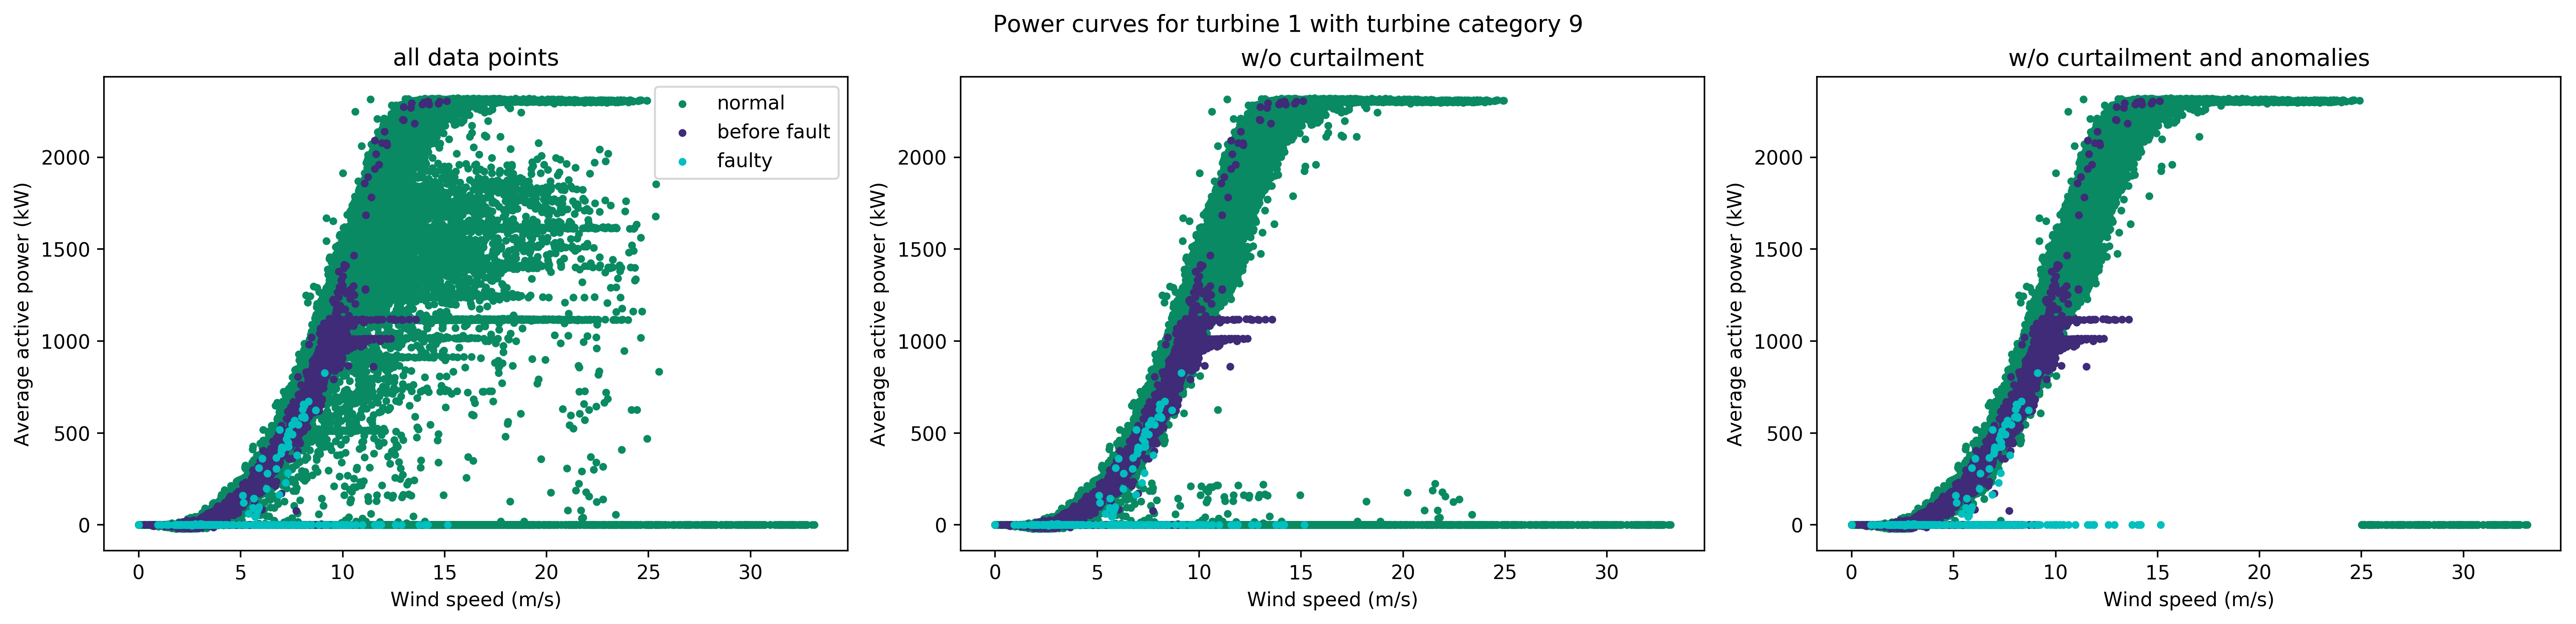
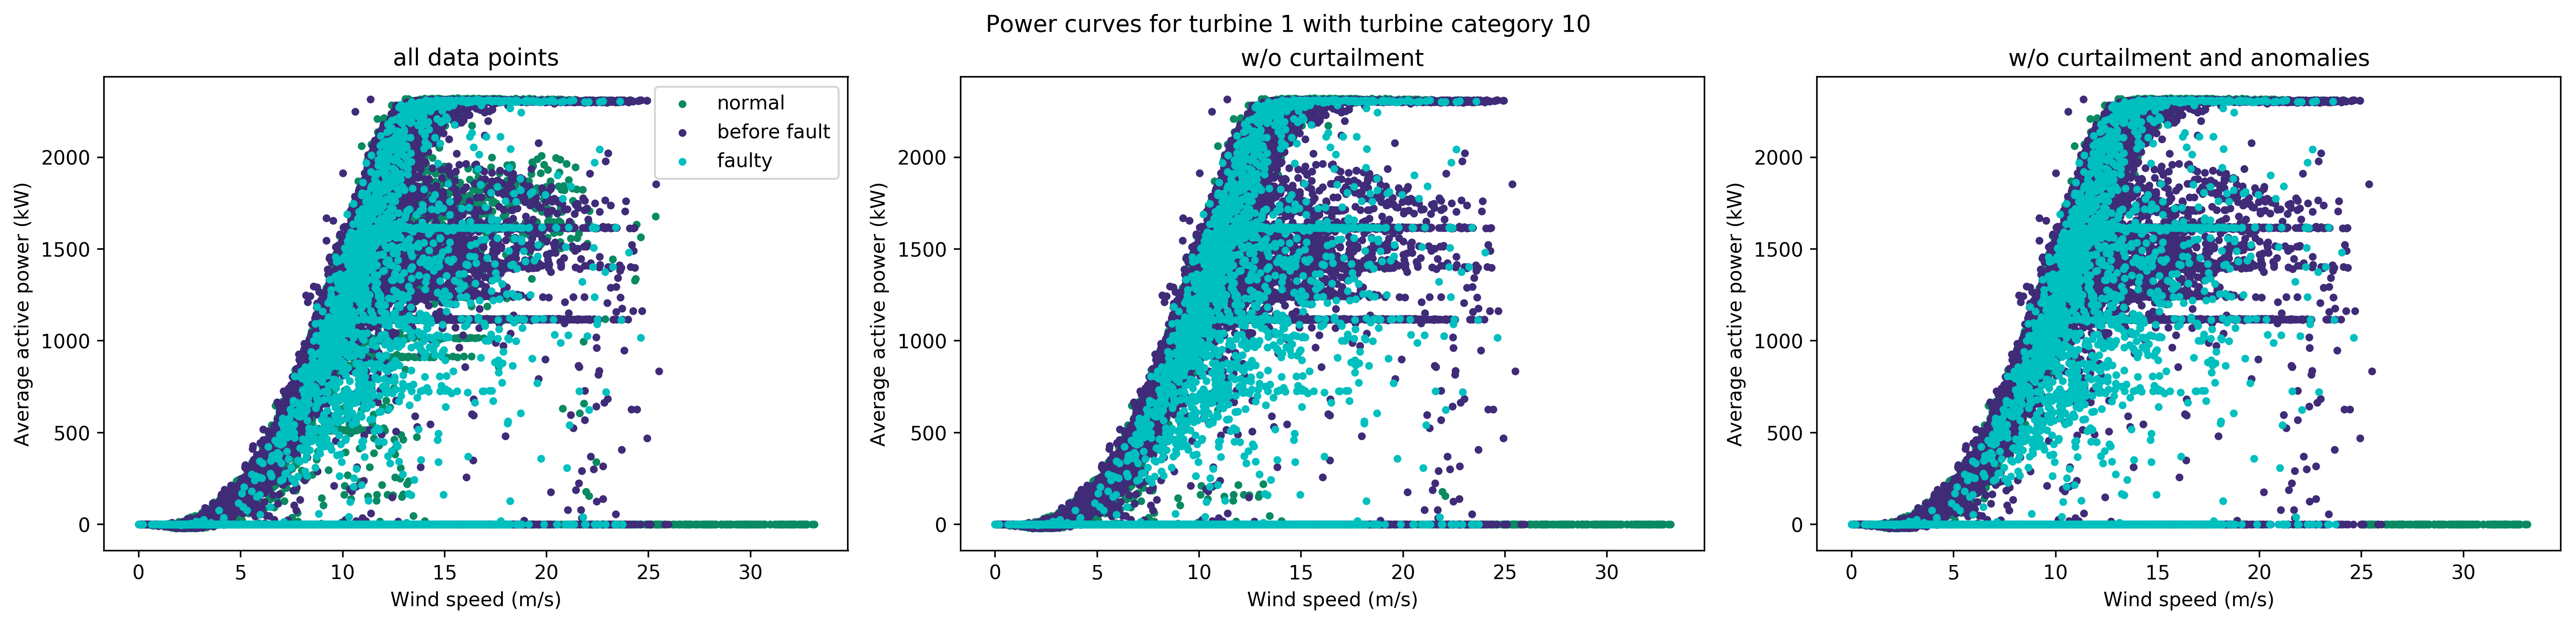
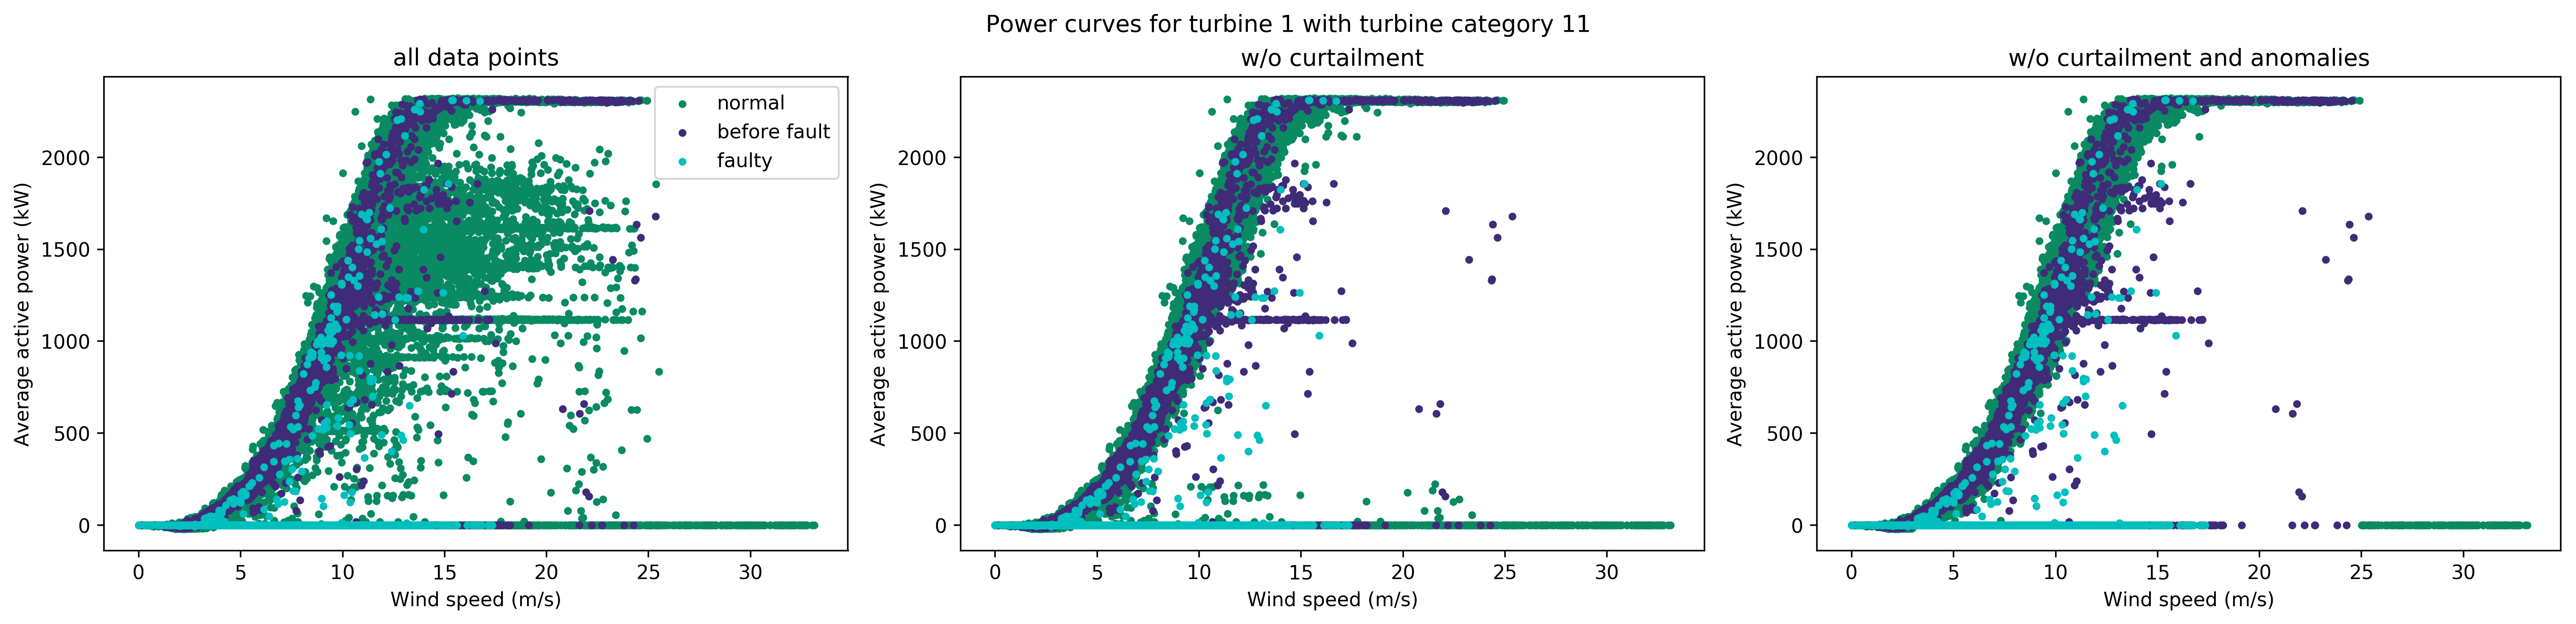
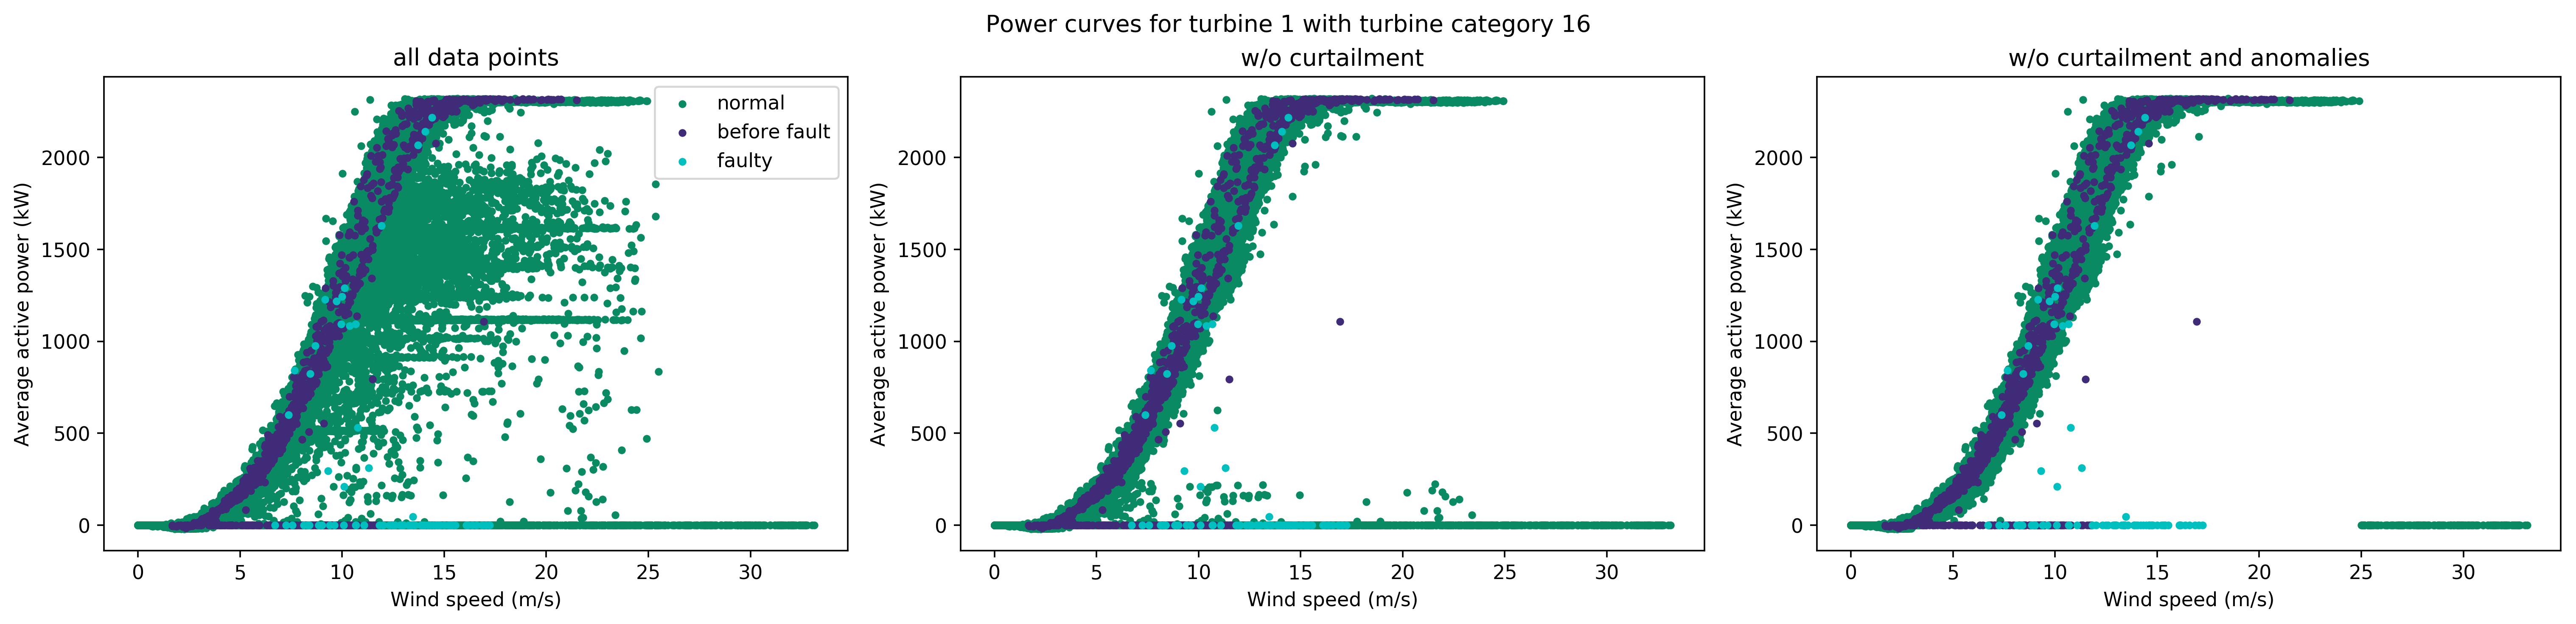
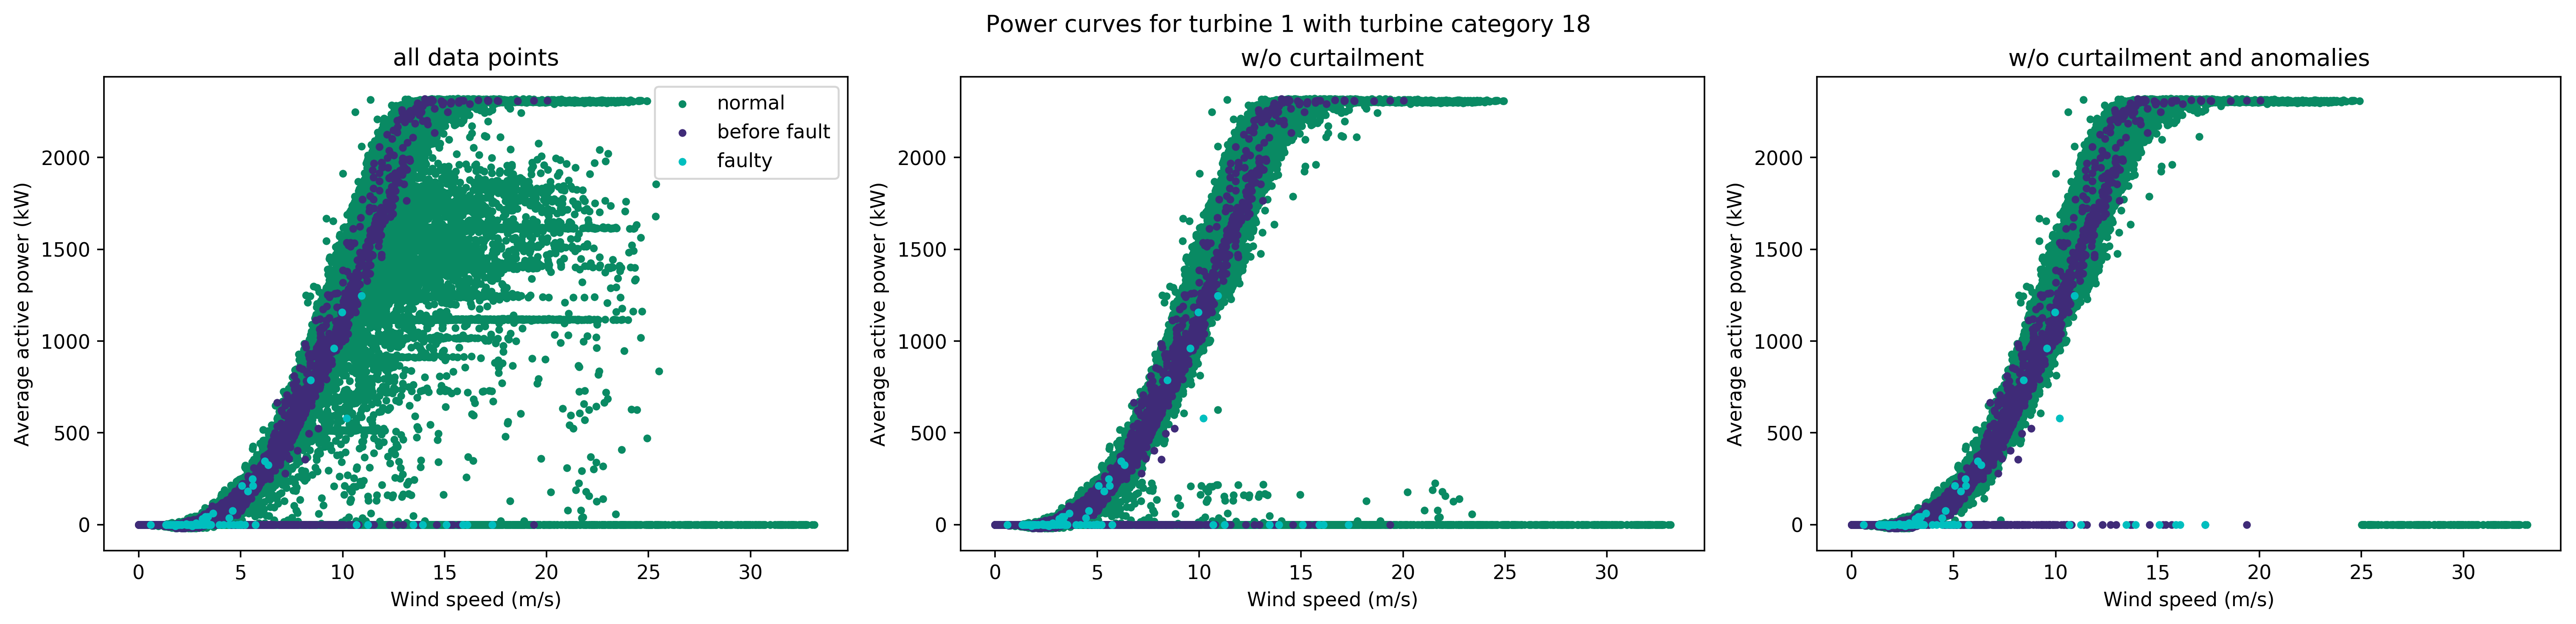
# filter data for plots
# normal w/ curtailment (all data)
df3 = df2x[df2x.hours == 9999]
# before fault
df4 = df2x[df2x.hours != 9999]
df4 = df4[df4.hours != 0]
# fault
df5 = df2x[df2x.hours == 0]
# normal w/o curtailment
df6 = df3[df3.curtailment == "normal"]
# normal w/o curtailment and unusual readings
df7 = df6[df6.unusual == "normal"]
# get x and y coordinates
# normal w/ curtailment
x1 = df3["ws_av"]
y1 = df3["ap_av"]
# before fault
x2 = df4["ws_av"]
y2 = df4["ap_av"]
# faulty
x3 = df5["ws_av"]
y3 = df5["ap_av"]
# normal w/o curtailment
x4 = df6["ws_av"]
y4 = df6["ap_av"]
# normal w/o curtailment and unusual readings
x5 = df7["ws_av"]
y5 = df7["ap_av"]
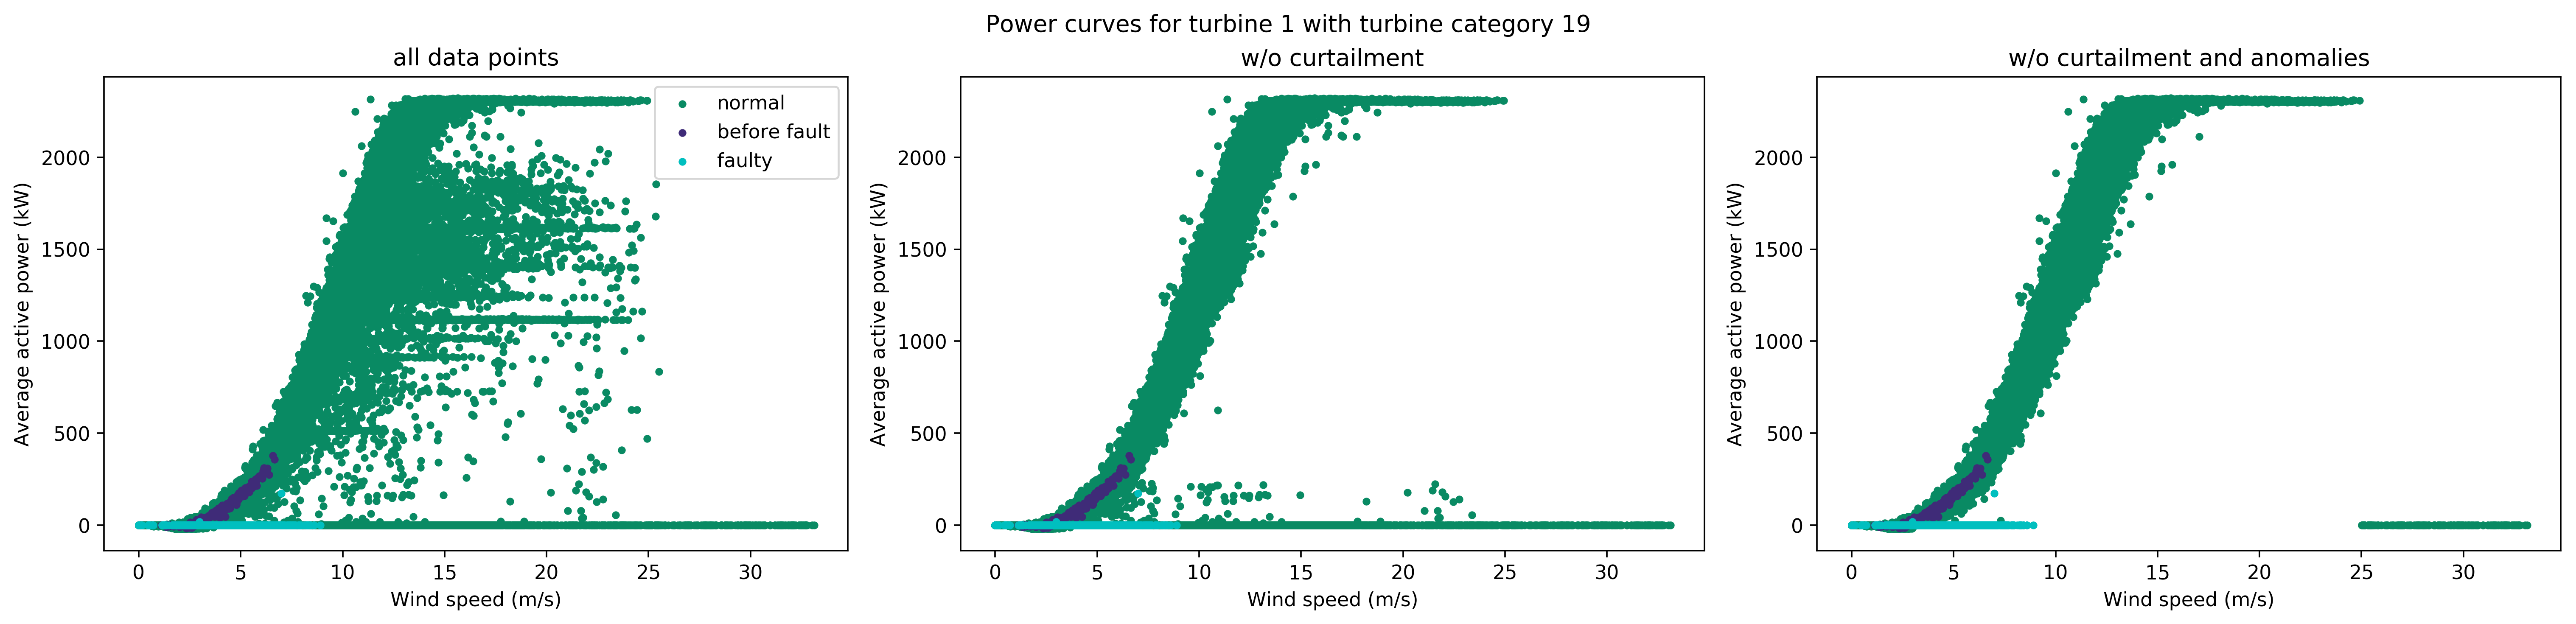
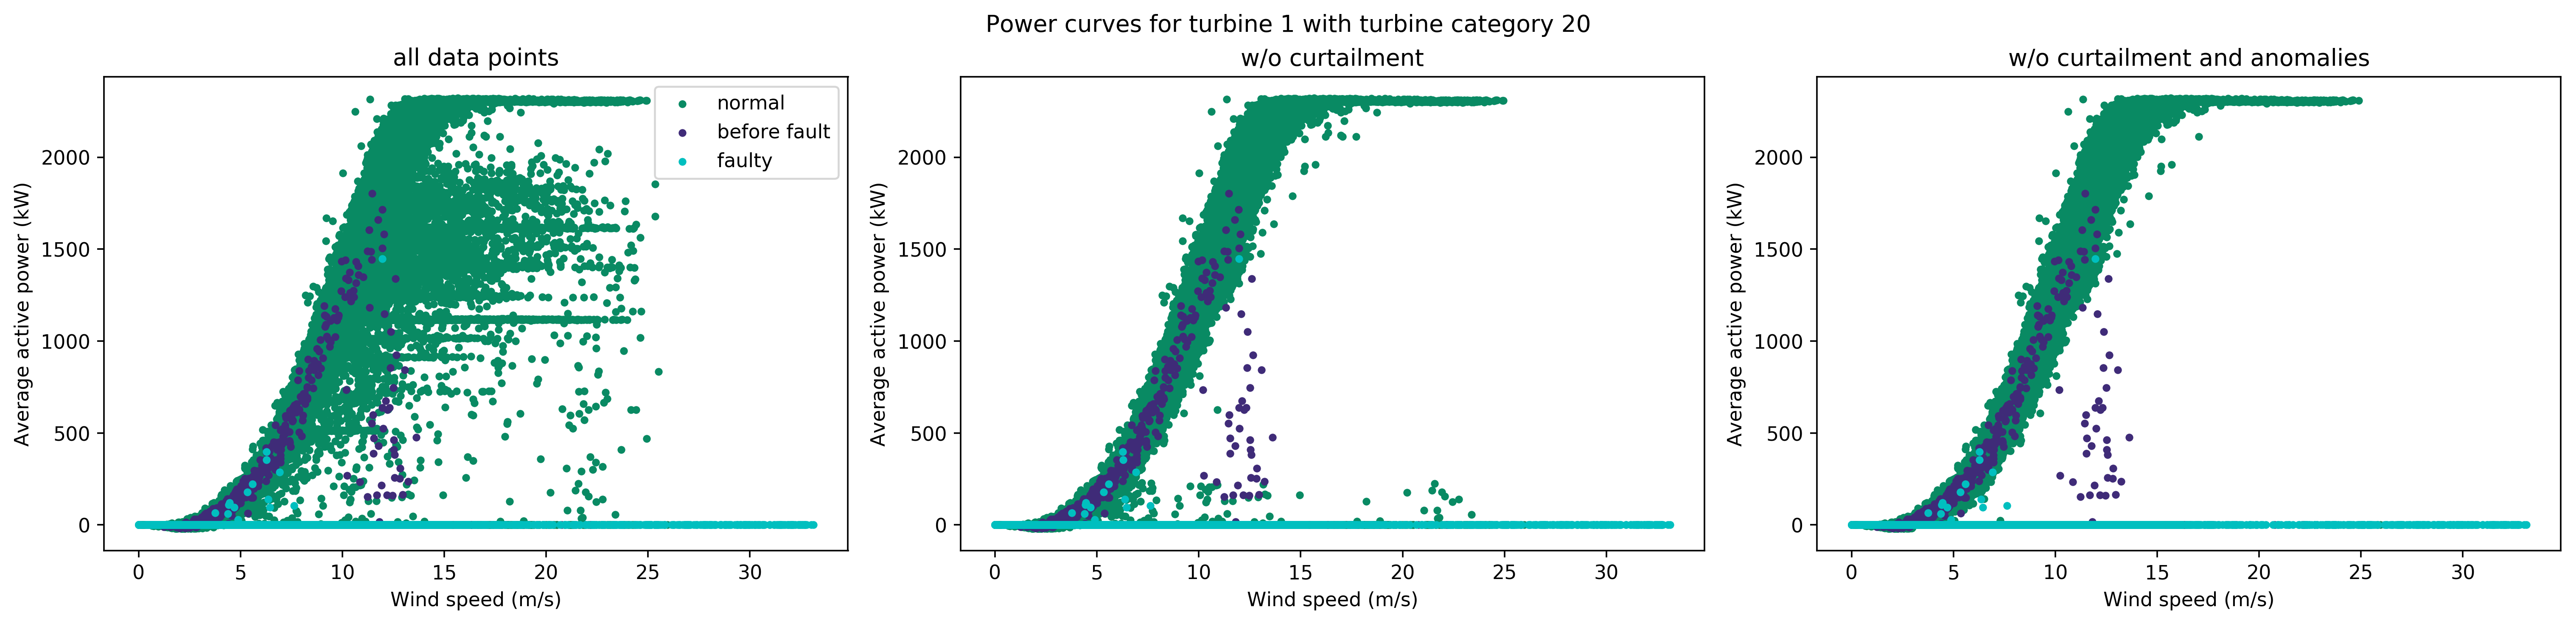
fig = plt.figure(figsize=(18.5, 4.5), dpi=1500)
ax1 = fig.add_subplot(131)
ax1.scatter(x1, y1, c="#098A63", label="normal", marker=".")
ax1.scatter(x2, y2, c="#3F2B78", label="before fault", marker=".")
ax1.scatter(x3, y3, c="c", label="faulty", marker=".")
ax1.legend()
plt.xlabel("Wind speed (m/s)")
plt.ylabel("Average active power (kW)")
plt.title("all data points")
ax2 = fig.add_subplot(132)
ax2.scatter(x4, y4, c="#098A63", marker=".")
ax2.scatter(x2, y2, c="#3F2B78", marker=".")
ax2.scatter(x3, y3, c="c", marker=".")
plt.xlabel("Wind speed (m/s)")
plt.ylabel("Average active power (kW)")
plt.title("w/o curtailment")
ax3 = fig.add_subplot(133)
ax3.scatter(x5, y5, c="#098A63", marker=".")
ax3.scatter(x2, y2, c="#3F2B78", marker=".")
ax3.scatter(x3, y3, c="c", marker=".")
plt.xlabel("Wind speed (m/s)")
plt.ylabel("Average active power (kW)")
plt.title("w/o curtailment and anomalies")
fig.suptitle(
"Power curves for turbine %s" % x + " with turbine category %s" % y
)
plt.tight_layout()
plt.subplots_adjust(top=0.88)
plt.show()